PROBLEM 6 Part 1. Give the adjacency matrix for the graph G as pictured below: Figure 2: A graph shows 6 vertices and 9 edges. The vertices are 1, 2, 3, 4, 5, and 6, represented by circles. The edges between the vertices are represented by arrows, as follows: 4 to 3; 3 to 2; 2 to 1; I to 6; 6 to 2; 3 to 4; 4 to 5; 5 to 6; and a self loop on vertex 5. Part 2. A directed graph G has 5 vertices, numbered 1 through 5. The 5 × 5 matrix A is the adjacency matrix for G. The matrices A? and A are given below. 0 1 0 0 0 O 0 0 1 0 0 0 1 0 0 0 0 1 0 0 1 0 0 1 10 1 1 0 0 0 0 O o 1 0 0 O 0 0 0 10 0 0 1 10 1 1 1 0 10 A² = A³ = Use the information given to answer the questions about the graph G. (a) Which vertices can reach vertex 2 by a walk of length 3? (b) Is there a walk of length 4 from vertex 4 to vertex 5 in G? (Hint: A= A² A²)
PROBLEM 6 Part 1. Give the adjacency matrix for the graph G as pictured below: Figure 2: A graph shows 6 vertices and 9 edges. The vertices are 1, 2, 3, 4, 5, and 6, represented by circles. The edges between the vertices are represented by arrows, as follows: 4 to 3; 3 to 2; 2 to 1; I to 6; 6 to 2; 3 to 4; 4 to 5; 5 to 6; and a self loop on vertex 5. Part 2. A directed graph G has 5 vertices, numbered 1 through 5. The 5 × 5 matrix A is the adjacency matrix for G. The matrices A? and A are given below. 0 1 0 0 0 O 0 0 1 0 0 0 1 0 0 0 0 1 0 0 1 0 0 1 10 1 1 0 0 0 0 O o 1 0 0 O 0 0 0 10 0 0 1 10 1 1 1 0 10 A² = A³ = Use the information given to answer the questions about the graph G. (a) Which vertices can reach vertex 2 by a walk of length 3? (b) Is there a walk of length 4 from vertex 4 to vertex 5 in G? (Hint: A= A² A²)

Linear Algebra: A Modern Introduction
4th Edition
ISBN:9781285463247
Author:David Poole
Publisher:David Poole
Chapter3: Matrices
Section3.7: Applications
Problem 72EQ

Related questions

Concept explainers
Contingency Table
A contingency table can be defined as the visual representation of the relationship between two or more categorical variables that can be evaluated and registered. It is a categorical version of the scatterplot, which is used to investigate the linear relationship between two variables. A contingency table is indeed a type of frequency distribution table that displays two variables at the same time.
Binomial Distribution
Binomial is an algebraic expression of the sum or the difference of two terms. Before knowing about binomial distribution, we must know about the binomial theorem.
Topic Video
Question
See attached, answer part 2
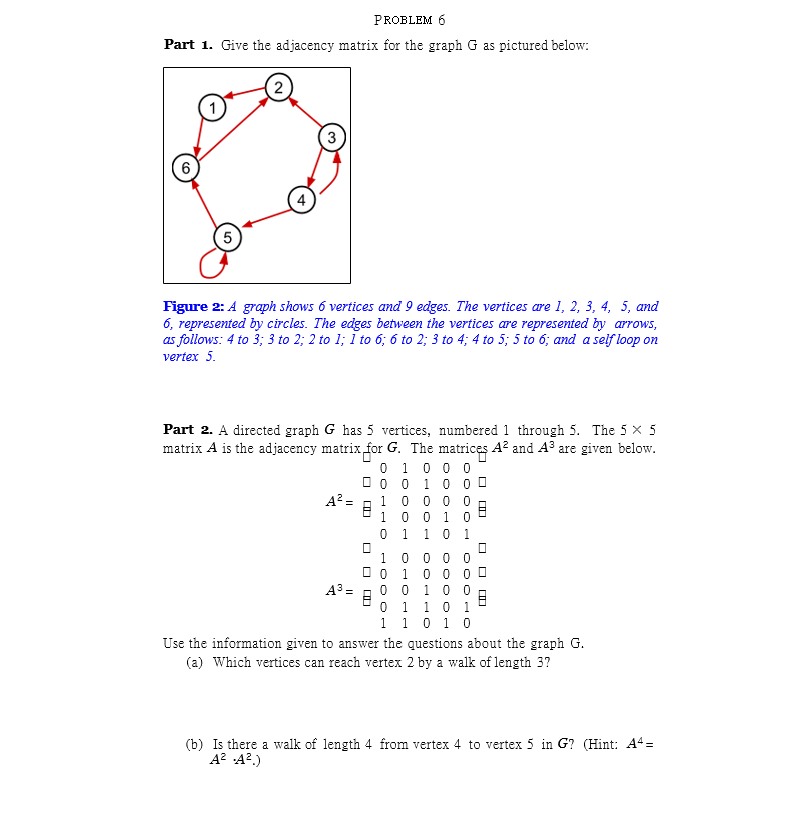
Transcribed Image Text:PROBLEM 6
Part 1. Give the adjacency matrix for the graph G as pictured below:
(2
3
6
Figure 2: A graph shows 6 vertices and 9 edges. The vertices are 1, 2, 3, 4, 5, and
6, represented by circles. The edges between the vertices are represented by arrows,
as follows: 4 to 3; 3 to 2; 2 to 1; I to 6; 6 to 2; 3 to 4; 4 to 5; 5 to 6; and a self loop on
vertex 5.
Part 2. A directed graph G has 5 vertices, numbered 1 through 5. The 5 × 5
matrix A is the adjacency matrix for G. The matrices A² and A³ are given below.
0 1 0 0 0
O 0 0 10 0 0
1 0 0 0 0
1 0 0 1 0
1 1 0
A² =
1.
1 0 0 0 0
1 0 0 0 0
0 0 10 0
0 1 10 1
1 0 1 0
A3 =
1
Use the information given to answer the questions about the graph
(a) Which vertices can reach vertex 2 by a walk of length 3?
(b) Is there a walk of length 4 from vertex 4 to vertex 5 in G? (Hint: A4=
A? A?.)
Expert Solution
This question has been solved!
Explore an expertly crafted, step-by-step solution for a thorough understanding of key concepts.

This is a popular solution!

Trending now
This is a popular solution!

Step by step
Solved in 4 steps

Knowledge Booster


Learn more about
Need a deep-dive on the concept behind this application? Look no further. Learn more about this topic, advanced-math and related others by exploring similar questions and additional content below.Recommended textbooks for you
Linear Algebra: A Modern Introduction
Algebra
ISBN:
9781285463247
Author:
David Poole
Publisher:
Cengage Learning

College Algebra
Algebra
ISBN:
9781305115545
Author:
James Stewart, Lothar Redlin, Saleem Watson
Publisher:
Cengage Learning
Linear Algebra: A Modern Introduction
Algebra
ISBN:
9781285463247
Author:
David Poole
Publisher:
Cengage Learning
College Algebra
Algebra
ISBN:
9781305115545
Author:
James Stewart, Lothar Redlin, Saleem Watson
Publisher:
Cengage Learning