Question No 3 A small project is composed of 7 activities whose time estimates are listed in the table below. activities are identified by their beginning (i) and ending (i) node numbers. Activity (i- j) Optimistic Time (Weeks) Most Likely Time (Weeks) Pessimistic Time (weeks) 7 1-2 1 1 1-3 7 1-4 2 2 8 2- 5 1 1 1 3-5 2 14 4-6 8 5-6 3 15 a) Draw the network diagram of activities in the project. b) Find the expected duration and variance of each activity .What is the expected project length? c )Calculate the variance and standard deviation of the project length. What is the probability that the project will be completed ? i) at least 4 weeks earlier than expected time. i1) no more than 4 weeks later than expected time.
Question No 3 A small project is composed of 7 activities whose time estimates are listed in the table below. activities are identified by their beginning (i) and ending (i) node numbers. Activity (i- j) Optimistic Time (Weeks) Most Likely Time (Weeks) Pessimistic Time (weeks) 7 1-2 1 1 1-3 7 1-4 2 2 8 2- 5 1 1 1 3-5 2 14 4-6 8 5-6 3 15 a) Draw the network diagram of activities in the project. b) Find the expected duration and variance of each activity .What is the expected project length? c )Calculate the variance and standard deviation of the project length. What is the probability that the project will be completed ? i) at least 4 weeks earlier than expected time. i1) no more than 4 weeks later than expected time.

Linear Algebra: A Modern Introduction
4th Edition
ISBN:9781285463247
Author:David Poole
Publisher:David Poole
Chapter2: Systems Of Linear Equations
Section2.4: Applications
Problem 2EQ: 2. Suppose that in Example 2.27, 400 units of food A, 500 units of B, and 600 units of C are placed...

Related questions
Topic Video
Question
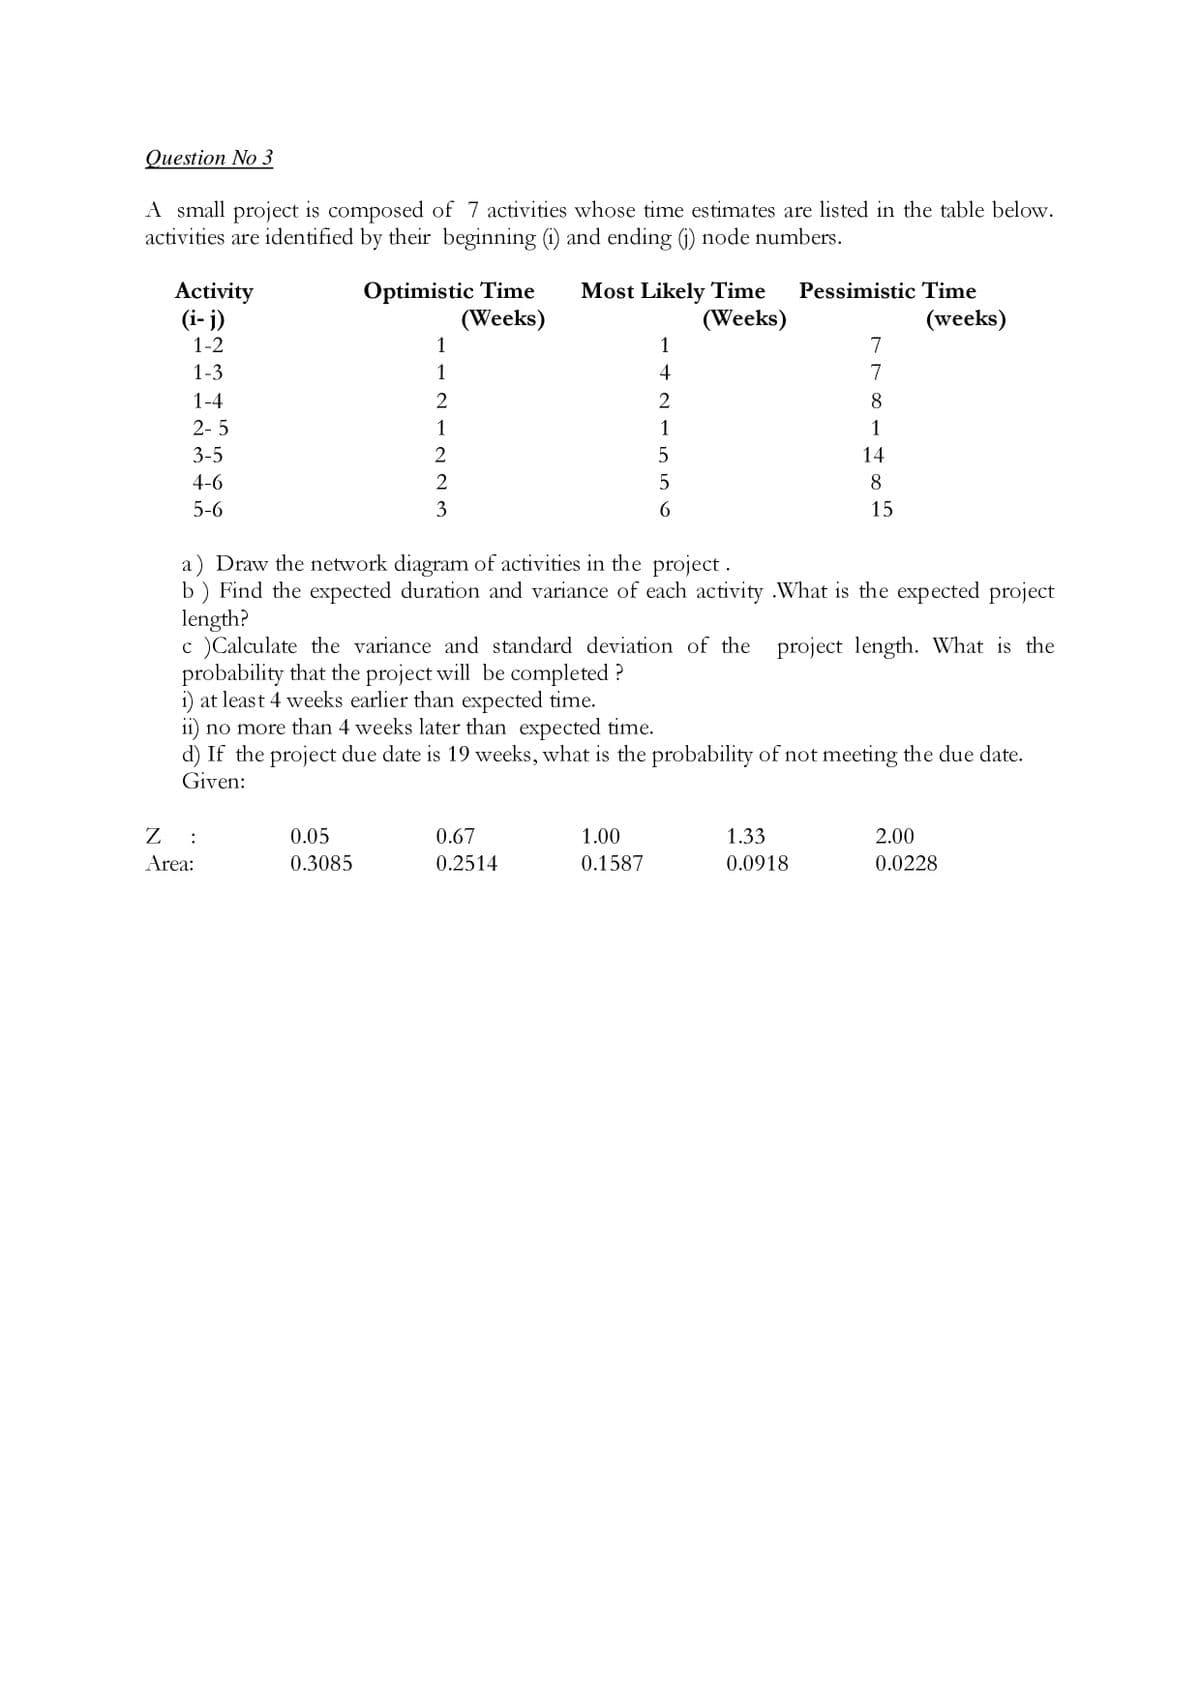
Transcribed Image Text:Question No 3
A small project is composed of 7 activities whose time estimates are listed in the table below.
activities are identified by their beginning (1) and ending (j) node numbers.
Activity
(i- j)
Optimistic Time
(Weeks)
Most Likely Time
(Weeks)
Pessimistic Time
(weeks)
1-2
1
1
7
1-3
1
4
7
1-4
2
8
2- 5
1
1
1
3-5
2
14
4-6
2
8
5-6
3
15
a) Draw the network diagram of activities in the project.
b ) Find the expected duration and variance of each activity .What is the expected project
length?
c )Calculate the variance and standard deviation of the project length. What is the
probability that the project will be completed ?
i) at least 4 weeks earlier than expected time.
i1) no more than 4 weeks later than expected time.
d) If the project due date is 19 weeks, what is the probability of not meeting the due date.
Given:
:
0.05
0.67
1.00
1.33
2.00
Area:
0.3085
0.2514
0.1587
0.0918
0.0228
Expert Solution
This question has been solved!
Explore an expertly crafted, step-by-step solution for a thorough understanding of key concepts.

This is a popular solution!

Trending now
This is a popular solution!

Step by step
Solved in 3 steps with 2 images

Knowledge Booster


Learn more about
Need a deep-dive on the concept behind this application? Look no further. Learn more about this topic, statistics and related others by exploring similar questions and additional content below.Recommended textbooks for you
Linear Algebra: A Modern Introduction
Algebra
ISBN:
9781285463247
Author:
David Poole
Publisher:
Cengage Learning
Linear Algebra: A Modern Introduction
Algebra
ISBN:
9781285463247
Author:
David Poole
Publisher:
Cengage Learning