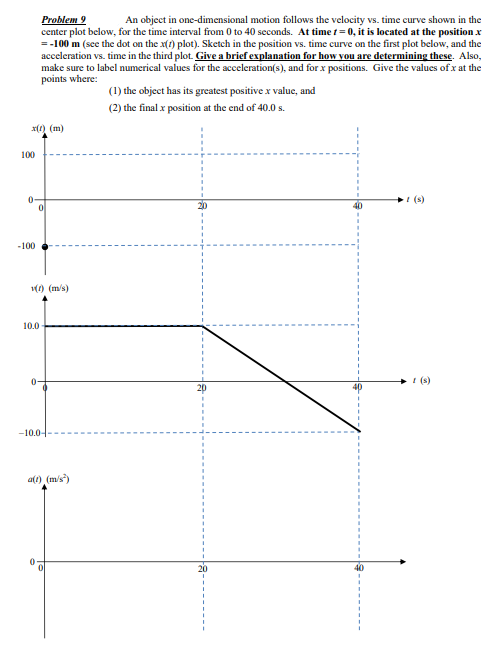
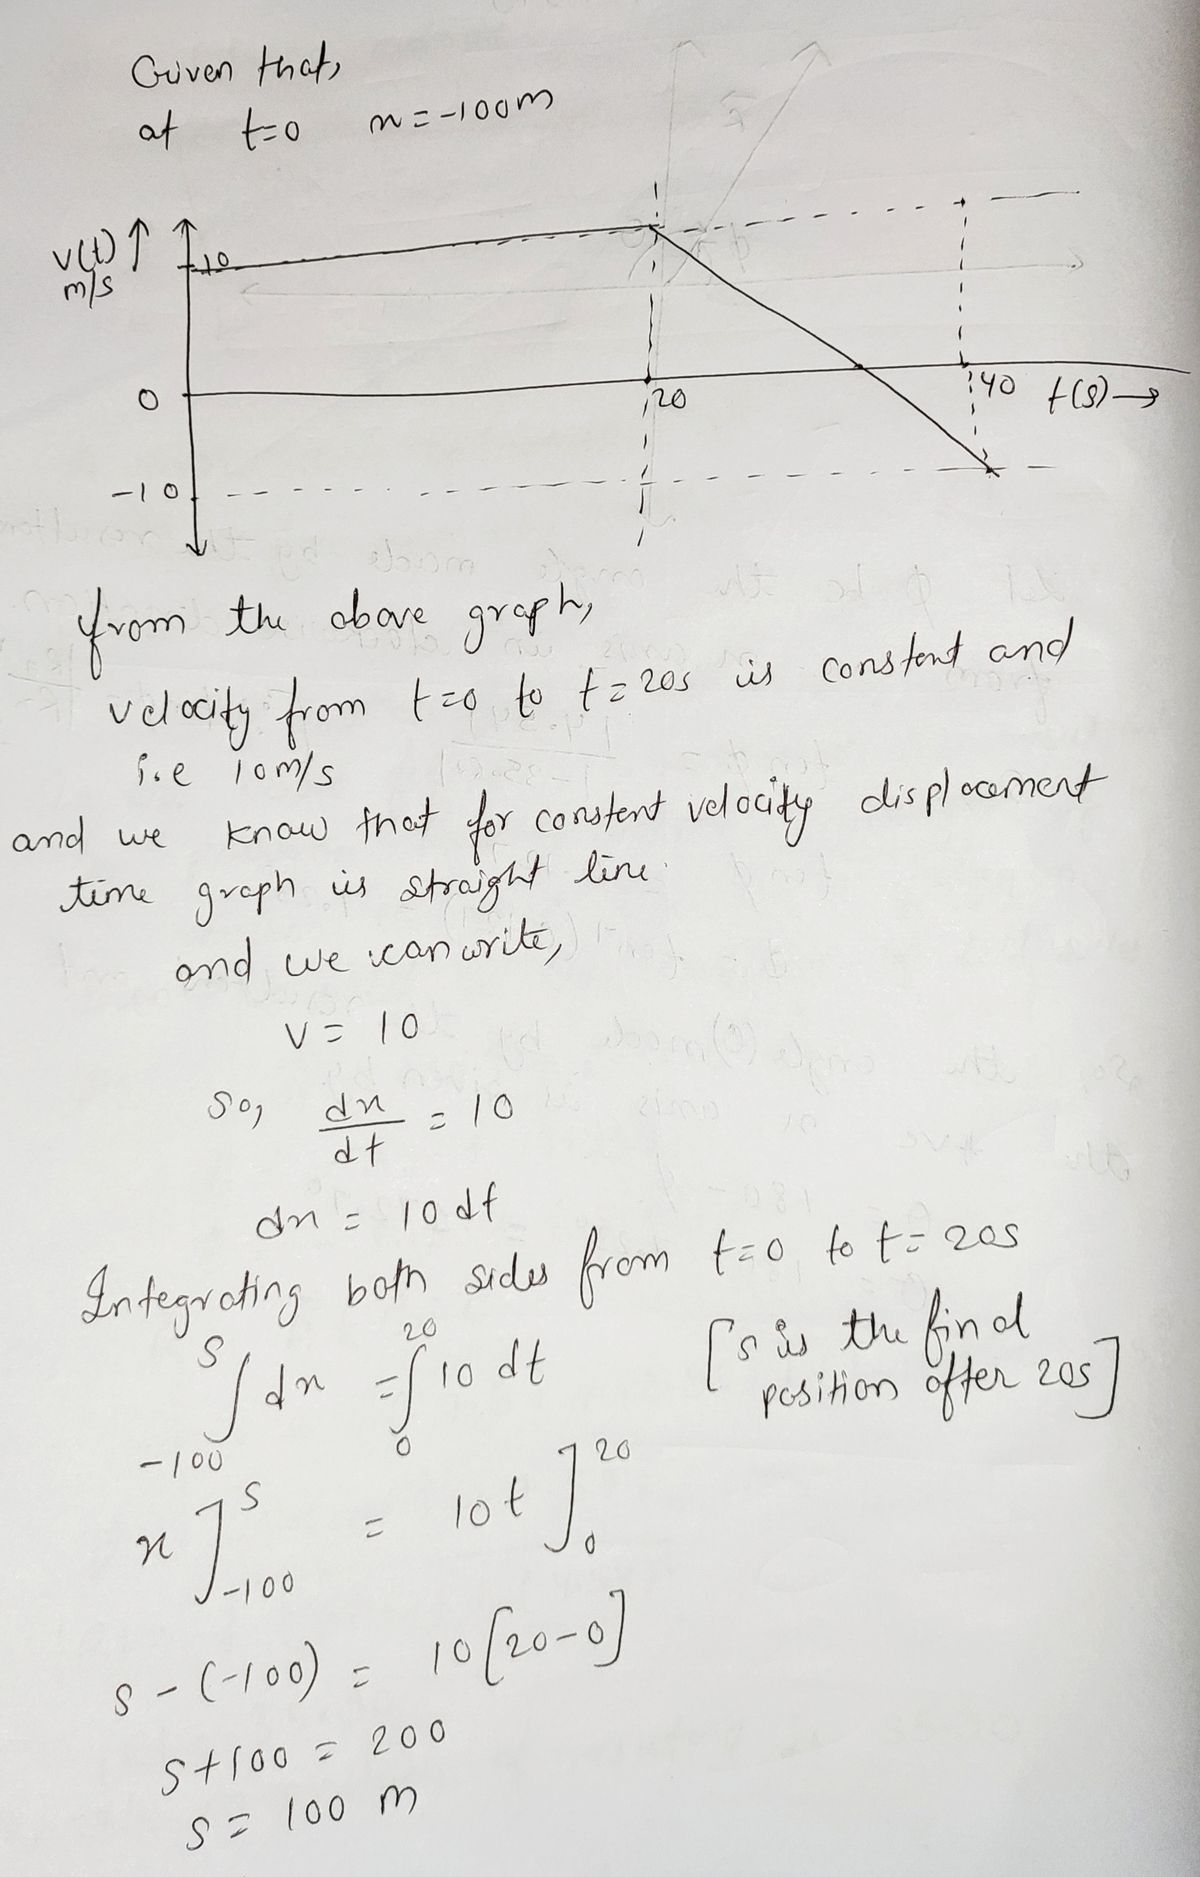
Problem 9 center plot below, for the time interval from 0 to 40 seconds. At time t=0, it is located at the position x =-100 m (see the dot on the x() plot). Sketch in the position vs. time curve on the first plot below, and the acceleration vs. time in the third plot. Give a brief explanation for how you are determining these. Also, make sure to label numerical values for the acceleration(s), and for x positions. Give the values of x at the points where: An object in one-dimensional motion follows the velocity vs. time curve shown in the (1) the object has its greatest positive x value, and (2) the final x position at the end of 40.0 s. x() (m)

Physics for Scientists and Engineers: Foundations and Connections
1st Edition
ISBN:9781133939146
Author:Katz, Debora M.
Publisher:Katz, Debora M.
Chapter4: Two-and-three Dimensional Motion
Section: Chapter Questions
Problem 26PQ: Figure P4.8 shows the motion diagram of two balls. The time interval between images is 0.036 s. Each...
icon
Related questions
icon
Concept explainers
Topic Video
Question

Please answer this Physics questions with a detailed explanation.


Problem 9
center plot below, for the time interval from 0 to 40 seconds. At time t = 0, it is located at the position x
=-100 m (see the dot on the x(1) plot). Sketch in the position vs. time curve on the first plot below, and the
acceleration vs. time in the third plot. Give a brief explanation for how you are determining these. Also,
make sure to label numerical values for the acceleration(s), and for x positions. Give the values of x at the
points where:
An object in one-dimensional motion follows the velocity vs. time curve shown in the
(1) the object has its greatest positive x valuc, and
(2) the final x position at the end of 40.0 s.
x() (m)
100
(s)
-100
1) (m/s)
10.0
! (s)
-10.0-
al) (m/s')
Transcribed Image Text:Problem 9 center plot below, for the time interval from 0 to 40 seconds. At time t = 0, it is located at the position x =-100 m (see the dot on the x(1) plot). Sketch in the position vs. time curve on the first plot below, and the acceleration vs. time in the third plot. Give a brief explanation for how you are determining these. Also, make sure to label numerical values for the acceleration(s), and for x positions. Give the values of x at the points where: An object in one-dimensional motion follows the velocity vs. time curve shown in the (1) the object has its greatest positive x valuc, and (2) the final x position at the end of 40.0 s. x() (m) 100 (s) -100 1) (m/s) 10.0 ! (s) -10.0- al) (m/s')
Expert Solution
Step 1

Physics homework question answer, step 1, image 1

trending now

Trending now

This is a popular solution!

steps

Step by step

Solved in 4 steps with 4 images

Blurred answer
Knowledge Booster
Displacement, velocity and acceleration
Learn more about
Need a deep-dive on the concept behind this application? Look no further. Learn more about this topic, physics and related others by exploring similar questions and additional content below.
Similar questions
  • SEE MORE QUESTIONS
Recommended textbooks for you
Physics for Scientists and Engineers: Foundations…
Physics
ISBN:
9781133939146
Author:
Katz, Debora M.
Publisher:
Cengage Learning
Glencoe Physics: Principles and Problems, Student…
Physics
ISBN:
9780078807213
Author:
Paul W. Zitzewitz
Publisher:
Glencoe/McGraw-Hill