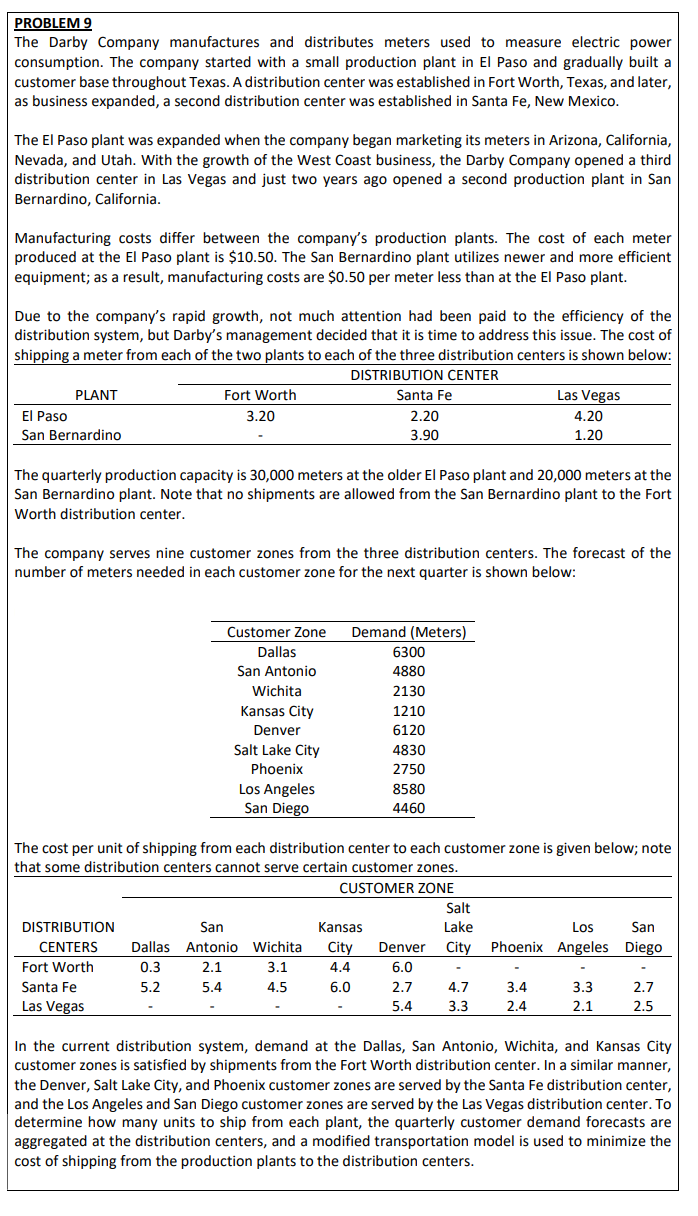
PROBLEM 9 The Darby Company manufactures and distributes meters used to measure electric power consumption. The company started with a small production plant in El Paso and gradually built a customer base throughout Texas. A distribution center was established in Fort Worth, Texas, and later, as business expanded, a second distribution center was established in Santa Fe, New Mexico. The El Paso plant was expanded when the company began marketing its meters in Arizona, California, Nevada, and Utah. With the growth of the West Coast business, the Darby Company opened a third distribution center in Las Vegas and just two years ago opened a second production plant in San Bernardino, California. Manufacturing costs differ between the company's production plants. The cost of each meter produced at the El Paso plant is $10.50. The San Bernardino plant utilizes newer and more efficient equipment; as a result, manufacturing costs are $0.50 per meter less than at the El Paso plant. Due to the company's rapid growth, not much attention had been paid to the efficiency of the distribution system, but Darby's management decided that it is time to address this issue. The cost of shipping a meter from each of the two plants to each of the three distribution centers is shown below: DISTRIBUTION CENTER PLANT El Paso San Bernardino Fort Worth 3.20 The quarterly production capacity is 30,000 meters at the older El Paso plant and 20,000 meters at the San Bernardino plant. Note that no shipments are allowed from the San Bernardino plant to the Fort Worth distribution center. The company serves nine customer zones from the three distribution centers. The forecast of the number of meters needed in each customer zone for the next quarter is shown below: Customer Zone Dallas San Antonio Wichita Kansas City Denver Salt Lake City Phoenix Santa Fe Las Vegas Los Angeles San Diego Santa Fe 2.20 3.90 DISTRIBUTION San CENTERS Dallas Antonio Wichita Fort Worth 0.3 2.1 3.1 5.2 5.4 4.5 Demand (Meters) The cost per unit of shipping from each distribution center to each customer zone is given below; note that some distribution centers cannot serve certain customer zones. CUSTOMER ZONE Kansas City 4.4 6.0 6300 4880 2130 1210 6120 4830 2750 8580 4460 Las Vegas 4.20 1.20 Salt Lake Los San Denver City Phoenix Angeles Diego 6.0 2.7 5.4 4.7 3.3 3.4 2.4 3.3 2.1 2.7 2.5 In the current distribution system, demand at the Dallas, San Antonio, Wichita, and Kansas City customer zones is satisfied by shipments from the Fort Worth distribution center. In a similar manner, the Denver, Salt Lake City, and Phoenix customer zones are served by the Santa Fe distribution center, and the Los Angeles and San Diego customer zones are served by the Las Vegas distribution center. To determine how many units to ship from each plant, the quarterly customer demand forecasts are aggregated at the distribution centers, and a modified transportation model is used to minimize the cost of shipping from the production plants to the distribution centers.
PROBLEM 9 The Darby Company manufactures and distributes meters used to measure electric power consumption. The company started with a small production plant in El Paso and gradually built a customer base throughout Texas. A distribution center was established in Fort Worth, Texas, and later, as business expanded, a second distribution center was established in Santa Fe, New Mexico. The El Paso plant was expanded when the company began marketing its meters in Arizona, California, Nevada, and Utah. With the growth of the West Coast business, the Darby Company opened a third distribution center in Las Vegas and just two years ago opened a second production plant in San Bernardino, California. Manufacturing costs differ between the company's production plants. The cost of each meter produced at the El Paso plant is $10.50. The San Bernardino plant utilizes newer and more efficient equipment; as a result, manufacturing costs are $0.50 per meter less than at the El Paso plant. Due to the company's rapid growth, not much attention had been paid to the efficiency of the distribution system, but Darby's management decided that it is time to address this issue. The cost of shipping a meter from each of the two plants to each of the three distribution centers is shown below: DISTRIBUTION CENTER PLANT El Paso San Bernardino Fort Worth 3.20 The quarterly production capacity is 30,000 meters at the older El Paso plant and 20,000 meters at the San Bernardino plant. Note that no shipments are allowed from the San Bernardino plant to the Fort Worth distribution center. The company serves nine customer zones from the three distribution centers. The forecast of the number of meters needed in each customer zone for the next quarter is shown below: Customer Zone Dallas San Antonio Wichita Kansas City Denver Salt Lake City Phoenix Santa Fe Las Vegas Los Angeles San Diego Santa Fe 2.20 3.90 DISTRIBUTION San CENTERS Dallas Antonio Wichita Fort Worth 0.3 2.1 3.1 5.2 5.4 4.5 Demand (Meters) The cost per unit of shipping from each distribution center to each customer zone is given below; note that some distribution centers cannot serve certain customer zones. CUSTOMER ZONE Kansas City 4.4 6.0 6300 4880 2130 1210 6120 4830 2750 8580 4460 Las Vegas 4.20 1.20 Salt Lake Los San Denver City Phoenix Angeles Diego 6.0 2.7 5.4 4.7 3.3 3.4 2.4 3.3 2.1 2.7 2.5 In the current distribution system, demand at the Dallas, San Antonio, Wichita, and Kansas City customer zones is satisfied by shipments from the Fort Worth distribution center. In a similar manner, the Denver, Salt Lake City, and Phoenix customer zones are served by the Santa Fe distribution center, and the Los Angeles and San Diego customer zones are served by the Las Vegas distribution center. To determine how many units to ship from each plant, the quarterly customer demand forecasts are aggregated at the distribution centers, and a modified transportation model is used to minimize the cost of shipping from the production plants to the distribution centers.

Operations Research : Applications and Algorithms
4th Edition
ISBN:9780534380588
Author:Wayne L. Winston
Publisher:Wayne L. Winston
Chapter20: Queuing Theory
Section20.10: Exponential Queues In Series And Open Queuing Networks
Problem 7P

Related questions

Question
Transcribed Image Text:PROBLEM 9
The Darby Company manufactures and distributes meters used to measure electric power
consumption. The company started with a small production plant in El Paso and gradually built a
customer base throughout Texas. A distribution center was established in Fort Worth, Texas, and later,
as business expanded, a second distribution center was established in Santa Fe, New Mexico.
The El Paso plant was expanded when the company began marketing its meters in Arizona, California,
Nevada, and Utah. With the growth of the West Coast business, the Darby Company opened a third
distribution center in Las Vegas and just two years ago opened a second production plant in San
Bernardino, California.
Manufacturing costs differ between the company's production plants. The cost of each meter
produced at the El Paso plant is $10.50. The San Bernardino plant utilizes newer and more efficient
equipment; as a result, manufacturing costs are $0.50 per meter less than at the El Paso plant.
Due to the company's rapid growth, not much attention had been paid to the efficiency of the
distribution system, but Darby's management decided that it is time to address this issue. The cost of
shipping a meter from each of the two plants to each of the three distribution centers is shown below:
DISTRIBUTION CENTER
PLANT
El Paso
San Bernardino
Fort Worth
3.20
The quarterly production capacity is 30,000 meters at the older El Paso plant and 20,000 meters at the
San Bernardino plant. Note that no shipments are allowed from the San Bernardino plant to the Fort
Worth distribution center.
The company serves nine customer zones from the three distribution centers. The forecast of the
number of meters needed in each customer zone for the next quarter is shown below:
Customer Zone
Dallas
San Antonio
Wichita
Kansas City
Denver
Salt Lake City
Phoenix
2.1
5.4
Los Angeles
San Diego
Santa Fe
2.20
3.90
DISTRIBUTION
San
CENTERS Dallas Antonio Wichita
Fort Worth
0.3
3.1
Santa Fe
5.2
4.5
Las Vegas
Demand (Meters)
Kansas
City
4.4
6.0
6300
4880
The cost per unit of shipping from each distribution center to each customer zone is given below; note
that some distribution centers cannot serve certain customer zones.
CUSTOMER ZONE
2130
1210
6120
4830
2750
8580
4460
Las Vegas
4.20
1.20
Salt
Lake
Los
Denver City Phoenix Angeles
6.0
2.7
5.4
4.7
3.3
3.4
2.4
3.3
2.1
San
Diego
2.7
2.5
In the current distribution system, demand at the Dallas, San Antonio, Wichita, and Kansas City
customer zones is satisfied by shipments from the Fort Worth distribution center. In a similar manner,
the Denver, Salt Lake City, and Phoenix customer zones are served by the Santa Fe distribution center,
and the Los Angeles and San Diego customer zones are served by the Las Vegas distribution center. To
determine how many units to ship from each plant, the quarterly customer demand forecasts are
aggregated at the distribution centers, and a modified transportation model is used to minimize the
cost of shipping from the production plants to the distribution centers.
Expert Solution
This question has been solved!
Explore an expertly crafted, step-by-step solution for a thorough understanding of key concepts.

Step by step
Solved in 4 steps with 6 images

Knowledge Booster


Learn more about
Need a deep-dive on the concept behind this application? Look no further. Learn more about this topic, computer-science and related others by exploring similar questions and additional content below.Recommended textbooks for you
Operations Research : Applications and Algorithms
Computer Science
ISBN:
9780534380588
Author:
Wayne L. Winston
Publisher:
Brooks Cole

Principles of Information Security (MindTap Cours…
Computer Science
ISBN:
9781337102063
Author:
Michael E. Whitman, Herbert J. Mattord
Publisher:
Cengage Learning
Operations Research : Applications and Algorithms
Computer Science
ISBN:
9780534380588
Author:
Wayne L. Winston
Publisher:
Brooks Cole
Principles of Information Security (MindTap Cours…
Computer Science
ISBN:
9781337102063
Author:
Michael E. Whitman, Herbert J. Mattord
Publisher:
Cengage Learning