Problem Solving 1. Random samples with size 5 are drawn from the population containing the values 26, 32, 41, 50, 58, and 63. a. Determine the number of possible samples with size 5. b. Identify the distribution of the sample means. c. Compute the mean and standard error of the corresponding sampling distribution. 2. The average monthly income of service crews working in fast food chains is Php10,500 with standard deviation of Php500. If a random sample of 15 crews is selected, what is the mean, variance, and standard error of the corresponding distribution of the sample means?
Problem Solving 1. Random samples with size 5 are drawn from the population containing the values 26, 32, 41, 50, 58, and 63. a. Determine the number of possible samples with size 5. b. Identify the distribution of the sample means. c. Compute the mean and standard error of the corresponding sampling distribution. 2. The average monthly income of service crews working in fast food chains is Php10,500 with standard deviation of Php500. If a random sample of 15 crews is selected, what is the mean, variance, and standard error of the corresponding distribution of the sample means?

Glencoe Algebra 1, Student Edition, 9780079039897, 0079039898, 2018
18th Edition
ISBN:9780079039897
Author:Carter
Publisher:Carter
Chapter10: Statistics
Section10.4: Distributions Of Data
Problem 19PFA

Related questions
Question
Answer number 1 and 2 only pls. I don't want to waste my money here.
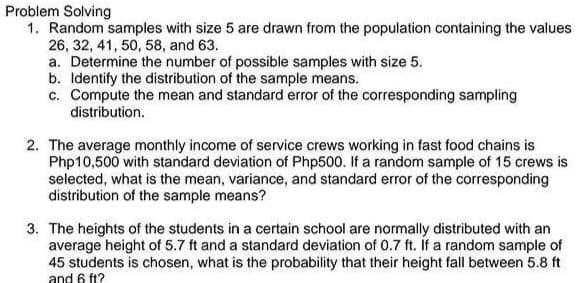
Transcribed Image Text:Problem Solving
1. Random samples with size 5 are drawn from the population containing the values
26, 32, 41, 50, 58, and 63.
a. Determine the number of possible samples with size 5.
b. Identify the distribution of the sample means.
c. Compute the mean and standard error of the corresponding sampling
distribution.
2. The average monthly income of service crews working in fast food chains is
Php10,500 with standard deviation of Php500. If a random sample of 15 crews is
selected, what is the mean, variance, and standard error of the corresponding
distribution of the sample means?
3. The heights of the students in a certain school are normally distributed with an
average height of 5.7 ft and a standard deviation of 0.7 ft. If a random sample of
45 students is chosen, what is the probability that their height fall between 5.8 ft
and 6 ft?
Expert Solution
This question has been solved!
Explore an expertly crafted, step-by-step solution for a thorough understanding of key concepts.

This is a popular solution!

Trending now
This is a popular solution!

Step by step
Solved in 2 steps

Recommended textbooks for you
Glencoe Algebra 1, Student Edition, 9780079039897…
Algebra
ISBN:
9780079039897
Author:
Carter
Publisher:
McGraw Hill
Glencoe Algebra 1, Student Edition, 9780079039897…
Algebra
ISBN:
9780079039897
Author:
Carter
Publisher:
McGraw Hill