Problems 827 Wal-Mart Stores, Inc. Target Corporation Total assets Total stockholders' equity Current liabilities Total liabilities Beginning-of-Year Balances $151,587 61,573 52,148 $37,349 15,633 11,117 21,716 90,014 Average net accounts receivable Average inventory Net cash provided by operating activities Other Data $ 7,124 6,517 4,125 $ 3,247 34,433 20,354 Instructions (a) For each company, compute the following ratios. (1) Current ratio. (2) Accounts receivable turmover. (3) Average collection period. (4) Inventory turnover. (7) Asset turnover. (8) Return on assets. (9) Return on common stockholders' equity. (10) Debt to assets ratio. (5) Davy in inventory (11) Times interest earned
Problems 827 Wal-Mart Stores, Inc. Target Corporation Total assets Total stockholders' equity Current liabilities Total liabilities Beginning-of-Year Balances $151,587 61,573 52,148 $37,349 15,633 11,117 21,716 90,014 Average net accounts receivable Average inventory Net cash provided by operating activities Other Data $ 7,124 6,517 4,125 $ 3,247 34,433 20,354 Instructions (a) For each company, compute the following ratios. (1) Current ratio. (2) Accounts receivable turmover. (3) Average collection period. (4) Inventory turnover. (7) Asset turnover. (8) Return on assets. (9) Return on common stockholders' equity. (10) Debt to assets ratio. (5) Davy in inventory (11) Times interest earned

Managerial Accounting
15th Edition
ISBN:9781337912020
Author:Carl Warren, Ph.d. Cma William B. Tayler
Publisher:Carl Warren, Ph.d. Cma William B. Tayler
Chapter16: Financial Statement Analysis
Section: Chapter Questions
Problem 4PB

Related questions
Question
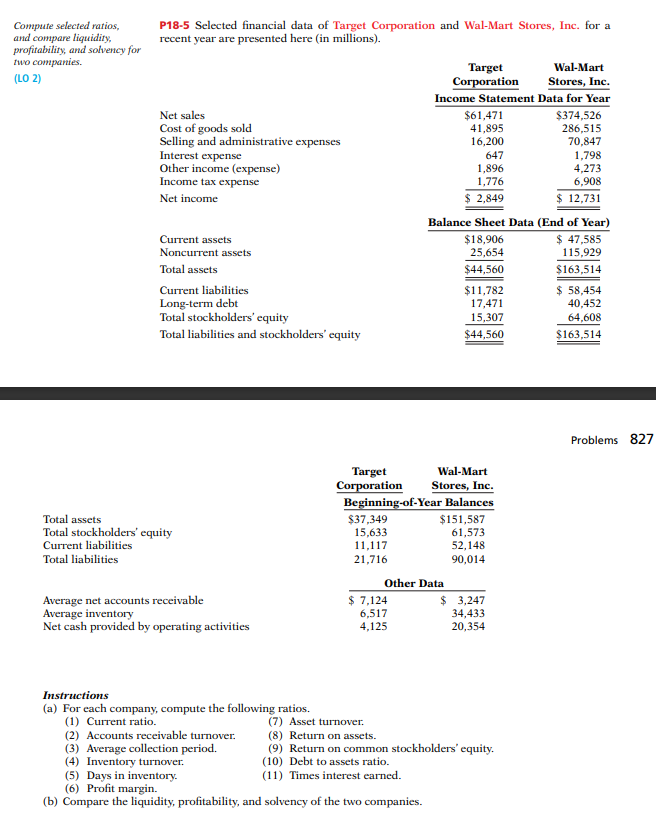
Transcribed Image Text:Compute selected ratios,
and compare liquidity,
profitability, and solvency for
P18-5 Selected financial data of Target Corporation and Wal-Mart Stores, Inc. for a
recent year are presented here (in millions).
two companies.
Wal-Mart
Target
Corporation
Income Statement Data for Year
(LO 2)
Stores, Inc.
$374,526
$61,471
41,895
16,200
Net sales
Cost of goods sold
Selling and administrative expenses
Interest expense
Other income (expense)
Income tax expense
647
1,896
1,776
286,515
70,847
1,798
4,273
6,908
$ 2,849
$ 12,731
Net income
Balance Sheet Data (End of Year)
$ 47,585
115,929
Current assets
$18,906
25,654
Noncurrent assets
Total assets
$44,560
$163,514
Current liabilities
$ 58,454
$11,782
17,471
Long-term debt
Total stockholders' cquity
40,452
15,307
64,608
Total liabilities and stockholders' equity
$44,560
$163,514
Problems 827
Target
Corporation
Beginning-of-Year Balances
Wal-Mart
Stores, Inc.
Total assets
Total stockholders' equity
Current liabilities
$37,349
15,633
11,117
$151,587
61,573
52,148
Total liabilities
21,716
90,014
Other Data
Average net accounts receivable
Average inventory
Net cash provided by operating activities
$ 7,124
6,517
4,125
$ 3,247
34,433
20,354
Instructions
(a) For each company, compute the following ratios.
(1) Current ratio.
(7) Asset turnover.
(8) Return on assets.
(9) Return on common stockholders' equity.
(10) Debt to assets ratio.
(11) Times interest earned.
(2) Accounts receivable turnover.
(3) Average collection period.
(4) Inventory turnover.
(5) Days in inventory.
(6) Profit margin.
(b) Compare the liquidity, profitability, and solvency of the two companies.
Expert Solution
This question has been solved!
Explore an expertly crafted, step-by-step solution for a thorough understanding of key concepts.

Step by step
Solved in 4 steps

Knowledge Booster


Learn more about
Need a deep-dive on the concept behind this application? Look no further. Learn more about this topic, accounting and related others by exploring similar questions and additional content below.Recommended textbooks for you
Managerial Accounting
Accounting
ISBN:
9781337912020
Author:
Carl Warren, Ph.d. Cma William B. Tayler
Publisher:
South-Western College Pub

Managerial Accounting: The Cornerstone of Busines…
Accounting
ISBN:
9781337115773
Author:
Maryanne M. Mowen, Don R. Hansen, Dan L. Heitger
Publisher:
Cengage Learning

Survey of Accounting (Accounting I)
Accounting
ISBN:
9781305961883
Author:
Carl Warren
Publisher:
Cengage Learning
Managerial Accounting
Accounting
ISBN:
9781337912020
Author:
Carl Warren, Ph.d. Cma William B. Tayler
Publisher:
South-Western College Pub
Managerial Accounting: The Cornerstone of Busines…
Accounting
ISBN:
9781337115773
Author:
Maryanne M. Mowen, Don R. Hansen, Dan L. Heitger
Publisher:
Cengage Learning
Survey of Accounting (Accounting I)
Accounting
ISBN:
9781305961883
Author:
Carl Warren
Publisher:
Cengage Learning


Financial Accounting: The Impact on Decision Make…
Accounting
ISBN:
9781305654174
Author:
Gary A. Porter, Curtis L. Norton
Publisher:
Cengage Learning

College Accounting, Chapters 1-27 (New in Account…
Accounting
ISBN:
9781305666160
Author:
James A. Heintz, Robert W. Parry
Publisher:
Cengage Learning