Problems Calculate the answer to each problem. You may use your calculator. Show some work. 14. Consider the following data showing a sample of 20 car speeds (in mph) on Route 24. First is the raw data, then a frequency distribution in which the bins have been determined but have not yet been filled in. 57 60 62 63 65 65 65 67 68 70 72 74 75 78 79 81 84 86 91 98 Speed (mph) 50-59 60-69 70-79 80-89 90-99 Frequency Relative freq. 1 5% a) The first column has been filled in as an example. Fill in the rest of the columns, both the frequency and relative fre the relative frequency as nt. b) Sketch the relative frequency histogram for this data. c) Circle the shape of this histogram: symmetric skewed skewed right d) Find the range. e) Find the mode. f) Find the median. g) Find the mean. h) Note that the mean is larger than the median. Why is that?
Problems Calculate the answer to each problem. You may use your calculator. Show some work. 14. Consider the following data showing a sample of 20 car speeds (in mph) on Route 24. First is the raw data, then a frequency distribution in which the bins have been determined but have not yet been filled in. 57 60 62 63 65 65 65 67 68 70 72 74 75 78 79 81 84 86 91 98 Speed (mph) 50-59 60-69 70-79 80-89 90-99 Frequency Relative freq. 1 5% a) The first column has been filled in as an example. Fill in the rest of the columns, both the frequency and relative fre the relative frequency as nt. b) Sketch the relative frequency histogram for this data. c) Circle the shape of this histogram: symmetric skewed skewed right d) Find the range. e) Find the mode. f) Find the median. g) Find the mean. h) Note that the mean is larger than the median. Why is that?

Glencoe Algebra 1, Student Edition, 9780079039897, 0079039898, 2018
18th Edition
ISBN:9780079039897
Author:Carter
Publisher:Carter
Chapter10: Statistics
Section10.5: Comparing Sets Of Data
Problem 26PFA

Related questions
Question
Transcribed Image Text:Problems
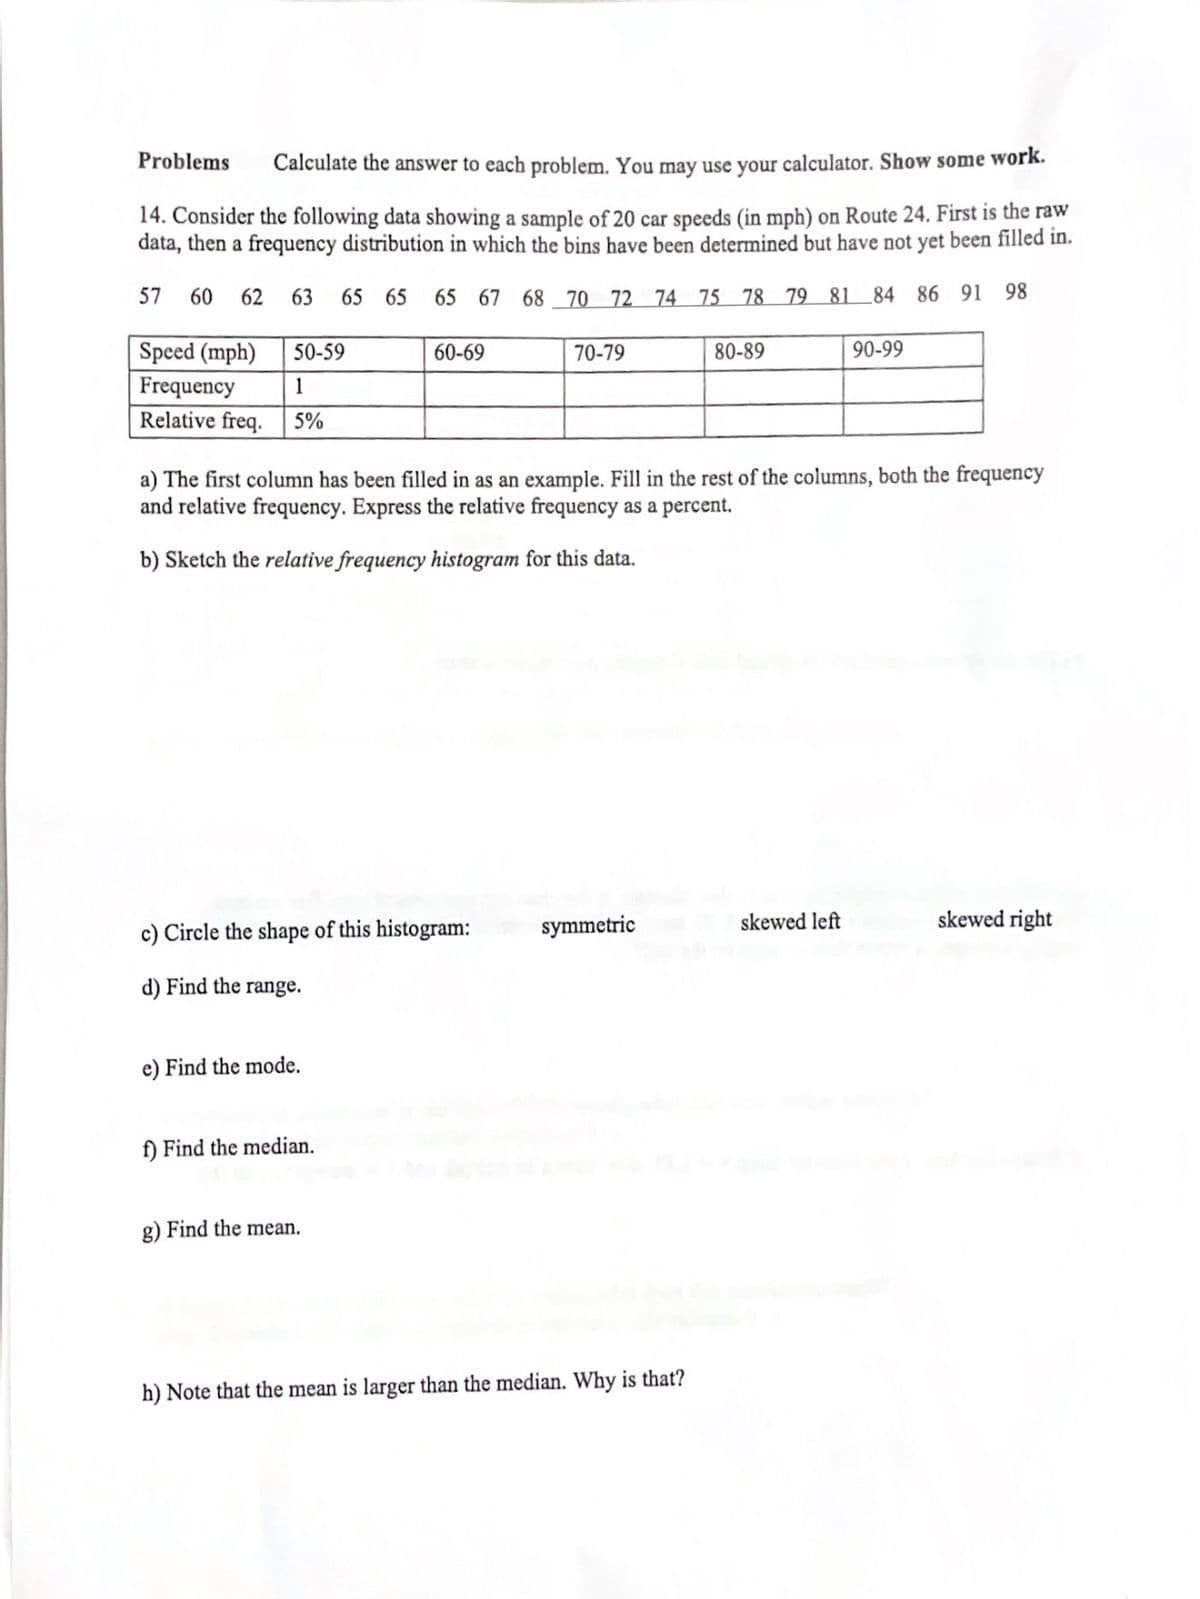
Calculate the answer to each problem. You may use your calculator. Show some work.
14. Consider the following data showing a sample of 20 car speeds (in mph) on Route 24. First is the raw
data, then a frequency distribution in which the bins have been determined but have not yet been filled in.
57
60
62
63
65 65
65 67 68 70 72 74 75 78 79 81 84 86 91 98
Speed (mph)
50-59
60-69
70-79
80-89
90-99
Frequency
1
Relative freq.
5%
a) The first column has been filled in as an example. Fill in the rest of the columns, both the frequency
and relative frequency. Express the relative frequency as a percent.
b) Sketch the relative frequency histogram for this data.
symmetric
skewed left
skewed right
c) Circle the shape of this histogram:
d) Find the range.
e) Find the mode.
f) Find the median.
g) Find the mean.
h) Note that the mean is larger than the median. Why is that?
Expert Solution
This question has been solved!
Explore an expertly crafted, step-by-step solution for a thorough understanding of key concepts.

This is a popular solution!

Trending now
This is a popular solution!

Step by step
Solved in 6 steps with 1 images

Recommended textbooks for you
Glencoe Algebra 1, Student Edition, 9780079039897…
Algebra
ISBN:
9780079039897
Author:
Carter
Publisher:
McGraw Hill

Holt Mcdougal Larson Pre-algebra: Student Edition…
Algebra
ISBN:
9780547587776
Author:
HOLT MCDOUGAL
Publisher:
HOLT MCDOUGAL
Glencoe Algebra 1, Student Edition, 9780079039897…
Algebra
ISBN:
9780079039897
Author:
Carter
Publisher:
McGraw Hill
Holt Mcdougal Larson Pre-algebra: Student Edition…
Algebra
ISBN:
9780547587776
Author:
HOLT MCDOUGAL
Publisher:
HOLT MCDOUGAL