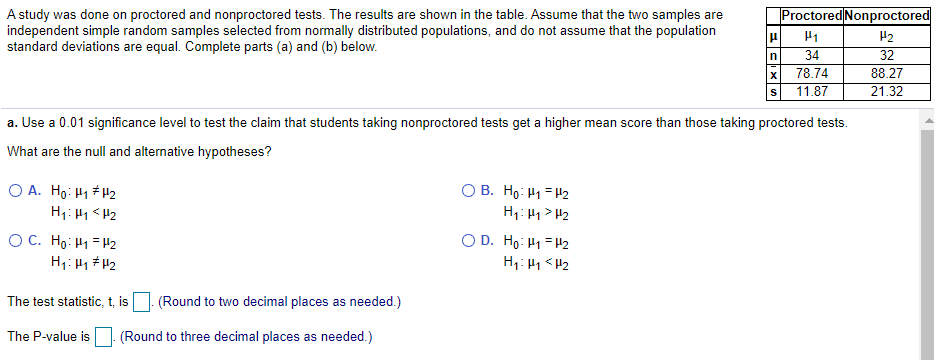
Proctored Nonproctorec A study was done on proctored and nonproctored tests. The results are shown in the table. Assume that the two samples are independent simple random samples selected from normally distributed populations, and do not assume that the population standard deviations are equal. Complete parts (a) and (b) below. H2 32 34 x 78.74 11.87 88.27 21.32 a. Use a 0.01 significance level to test the claim that students taking nonproctored tests get a higher mean score than those taking proctored tests.
Proctored Nonproctorec A study was done on proctored and nonproctored tests. The results are shown in the table. Assume that the two samples are independent simple random samples selected from normally distributed populations, and do not assume that the population standard deviations are equal. Complete parts (a) and (b) below. H2 32 34 x 78.74 11.87 88.27 21.32 a. Use a 0.01 significance level to test the claim that students taking nonproctored tests get a higher mean score than those taking proctored tests.

Glencoe Algebra 1, Student Edition, 9780079039897, 0079039898, 2018
18th Edition
ISBN:9780079039897
Author:Carter
Publisher:Carter
Chapter10: Statistics
Section10.5: Comparing Sets Of Data
Problem 3BGP

Related questions
Topic Video
Question
Transcribed Image Text:|Proctored Nonproctored
A study was done on proctored and nonproctored tests. The results are shown in the table. Assume that the two samples are
independent simple random samples selected from normally distributed populations, and do not assume that the population
standard deviations are equal. Complete parts (a) and (b) below.
H1
H2
34
32
78.74
88.27
11.87
21.32
a. Use a 0.01 significance level to test the claim that students taking nonproctored tests get a higher mean score than those taking proctored tests.
What are the null and alternative hypotheses?
O A. Ho: H1 H2
H1: H1 <H2
OC. Họ: H1 = H2
O B. Ho: H1 = H2
H1: H1> H2
O D. Ho: H1 = H2
H1: H1<H2
H1: H1 # H2
The test statistic, t, is
(Round to two decimal places as needed.)
The P-value is
(Round to three decimal places as needed.)
Expert Solution
This question has been solved!
Explore an expertly crafted, step-by-step solution for a thorough understanding of key concepts.

This is a popular solution!

Trending now
This is a popular solution!

Step by step
Solved in 3 steps with 6 images

Knowledge Booster


Learn more about
Need a deep-dive on the concept behind this application? Look no further. Learn more about this topic, statistics and related others by exploring similar questions and additional content below.Recommended textbooks for you
Glencoe Algebra 1, Student Edition, 9780079039897…
Algebra
ISBN:
9780079039897
Author:
Carter
Publisher:
McGraw Hill
Glencoe Algebra 1, Student Edition, 9780079039897…
Algebra
ISBN:
9780079039897
Author:
Carter
Publisher:
McGraw Hill