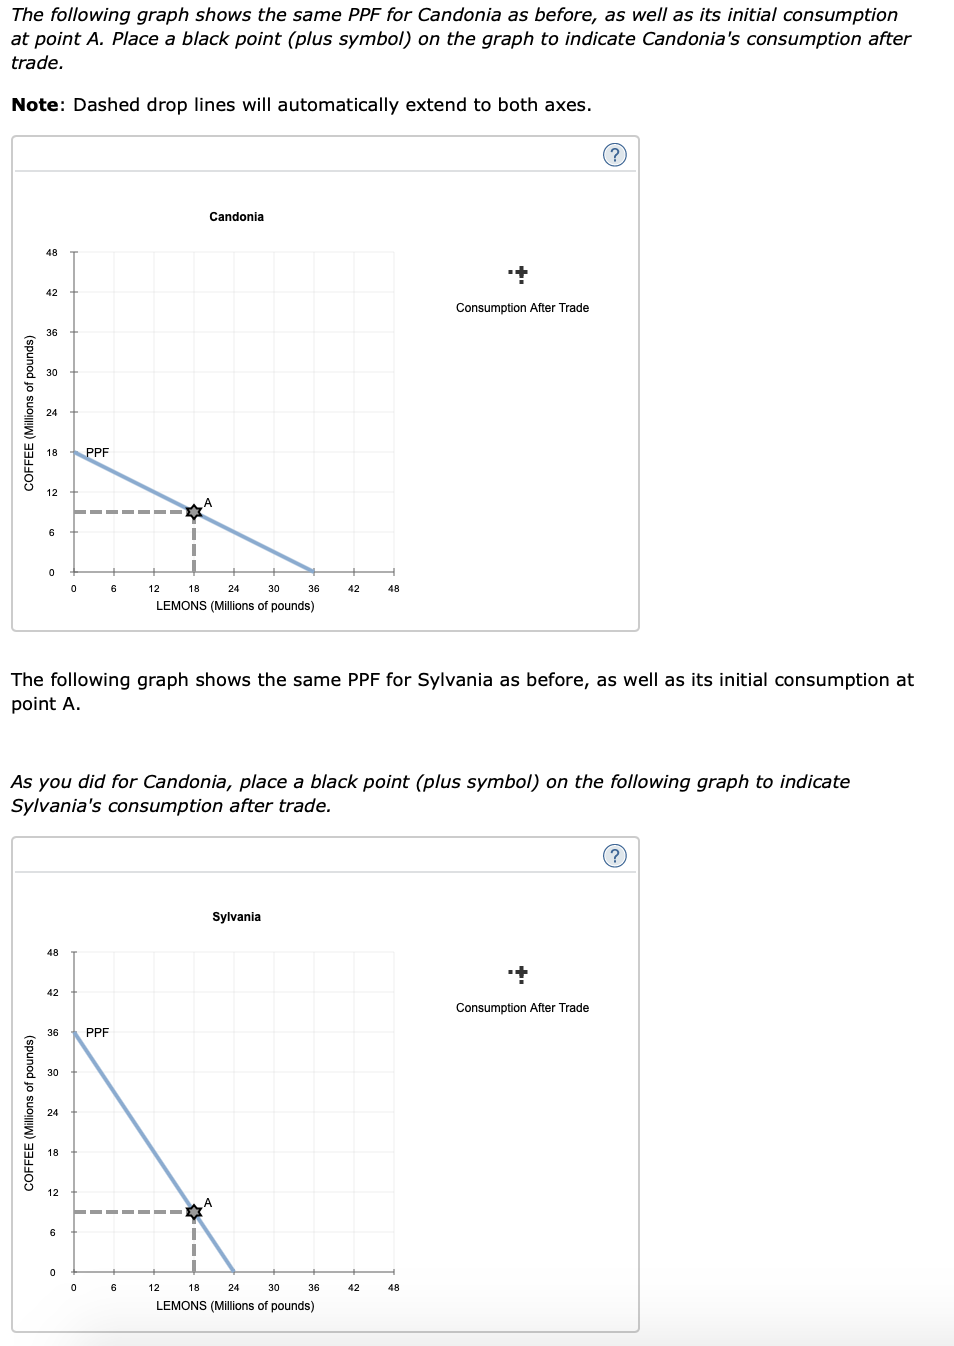
produce lemons and coffee, each initially (i.e., before specialization and trade) producing 18 million pounds of lemons and 9 million pounds of coffee, as indicated by the grey stars marked with the letter A. Candonia has a comparative advantage in the production of lemons, while Sylvania has a comparative advantage in the production of coffee. Suppose that Candonia and Sylvania specialize in the production of the goods in which each has a comparative advantage. After specialization, the two countries can produce a total of 36 million pounds of lemons and 36 million pounds of coffee. Suppose that Candonia and Sylvania agree to trade. Each country focuses its resources on producing only the good in which it has a comparative advantage. The countries decide to exchange 12 million pounds of lemons for 12 million pounds of coffee. This ratio of goods is known as the price of trade between Candonia and Sylvania. The following graph shows the same PPF for Candonia as before, as well as its initial consumption at point A. Place a black point (plus symbol) on the graph to indicate Candonia's consumption after the trade. Note: Dashed drop lines will automatically extend to both axes. True or False: Without engaging in international trade, Candonia and Sylvania would not have been able to consume at the after-trade consumption bundles. (Hint: Base this question on the answers you previously entered on this page.) -True or -False


When a country has a
The following graphs show the production possibilities frontiers (PPFs) for Candonia and Sylvania. Both countries
Note:-
- Do not provide handwritten solution. Maintain accuracy and quality in your answer. Take care of plagiarism.
- Answer completely.
- You will get up vote for sure.
produce lemons and coffee, each initially (i.e., before specialization and trade) producing 18 million pounds of lemons and 9 million pounds of coffee, as indicated by the grey stars marked with the letter A.
Candonia has a comparative advantage in the production of lemons, while Sylvania has a comparative advantage in the production of coffee. Suppose that Candonia and Sylvania specialize in the production of the goods in which each has a comparative advantage. After specialization, the two countries can produce a total of 36 million pounds of lemons and 36 million pounds of coffee.
Suppose that Candonia and Sylvania agree to trade. Each country focuses its resources on producing only the good in which it has a comparative advantage. The countries decide to exchange 12 million pounds of lemons for 12 million pounds of coffee. This ratio of goods is known as the price of trade between Candonia and Sylvania.
The following graph shows the same
Note: Dashed drop lines will automatically extend to both axes.
True or False: Without engaging in international trade, Candonia and Sylvania would not have been able to consume at the after-trade consumption bundles. (Hint: Base this question on the answers you previously entered on this page.)
-True
or
-False


Trending now
This is a popular solution!

Step by step
Solved in 3 steps with 2 images


