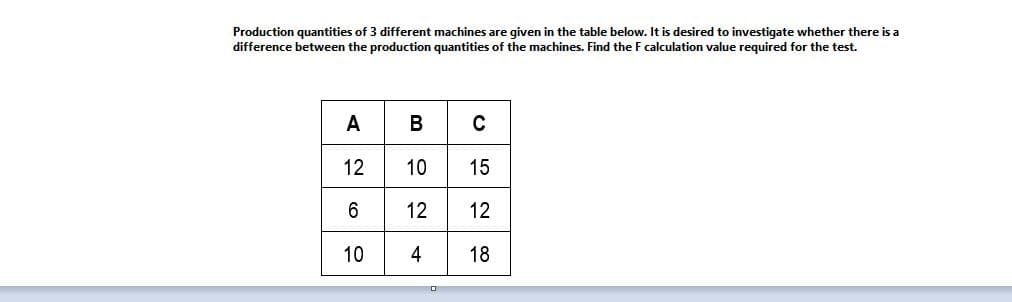
Production quantities of 3 different machines are given in the table below. It is desired to investigate whether there is a difference between the production quantities of the machines. Find the F calculation value required for the test. A B C 12 10 15 12 12 10 4 18


Q: You want O determine whether the reasons given by workers for continuing their education s related…
A: HERE given , significance level = 0.05 here test the claim reason and type of worker are…
Q: A researcher wants to know whether athletic women are more flexible than non - athletic women. For…
A:
Q: a) The table below presents data used to test whether the fidelity and the selectivity of 190 radios…
A: Here data is given ( Fidelity, selectivity) for low, Average and high N= 190 test statistic = 52.72…
Q: Answer #28 - #34 using this data set: f 7 1 6 4 5 3 4 1 3 1 2 1 3 31. What is the mean of X? (SHOW…
A: Given below
Q: Production quantities of 3 different machines are given in the table below. It is desired to…
A: Given data A B C 12 10 15 6 12 12 10 4 18
Q: A carton of ice cream is taken out of the freezer, and the ice cream’s tem- perature F (in degrees…
A: Given: t(min) F(t)(°F) 0 5.0 2 26.4 4 40.8 6 50.4 8 56.9 10 61.2 12 64.1 14 66.0…
Q: A marketing manager conducts a study to determine whether there is a relationship between a person’s…
A: For the given data set Find the Computed F test-ratio.Find the value of r Round of your answer up to…
Q: Fiber content (in grams per serving) and sugar content (in grams per serving) for nine high fiber…
A:
Q: To compute a student's Grade Point Average (GPA) for a term, the student's grades for each course…
A:
Q: A screening test run on a sample of participants revealed the following results: 80 sick people and…
A: Given, in a screening test 80 sick people and 50 healthy people were tested positive. 30 sick person…
Q: Compute the appropriate t-test.
A:
Q: proportion X expected respond ensity 2(x + 5) 0<x<1, f(x) = 11 0. elsewhere The proportion of…
A: The formula to compute expected value is,
Q: q 0.2 0.4 0.6 h(q) 809 662 542 0.8 444 Estimate h' (0.6) using the table above. h' (0.6)≈ 545 Submit…
A: To estimate h'(0.6) we have to, 1. Find the slope from q=0.2 to 0.6 2. Find the slope from q=0.6 to…
Q: 40 100 28 18 nin nax D3 %3D 62 126 20 40 60 80 100 120 140 of the following are true? (technical…
A: For D2 base number line should be there.
Q: To compute a student's Grade Point Average (GPA) for a term, the student's grades for each course…
A: A student's grades are given as follows. 4.0 in a 5 credit Math course 2.0 in a 3 credit Music…
Q: The following table shows the hot dogs bought from a street vendor over the course of eight days…
A: The independent variable is Temperature. The dependent variable is Demand. The given data implies…
Q: Students in a fifth-grade class were given an exam. During the next 2 years, the same students were…
A: answers are a) f(0) = 93 b) f(6) = 82.85 c) f(18) = 77.65 detailed explanation is given below
Q: f there is no seasonal effect on people getting sick, we would expect equal numbers of people…
A:
Q: the minimum wind speed generated by the storm. Frequency of Hurricane Direct Hits Category Number of…
A: We have given that the relative frequency table represents hurricanes that have made direct hits on…
Q: A survey of 185 public universities found that “the salaries and benefits of their presidents…
A: The salaries and benefits of their presidents continued to rise, though at a slower rate than in…
Q: To compute a student's Grade Point Average (GPA) for a term, the student's grades for each course…
A: Given Data 4 in a 5 credit course 1.8 in a 2 credit course 3.1 in a 4 credit course 2.8 in a 6…
Q: | 0.6 0.9 1.2 1.5 1.8 h(q) 23 42 77 141 256 Estimate h'(1.2) using the table above. h'(1.2) 2…
A:
Q: Find f(3.1) based on the following data points (2.2, 25.234) ; (2.9, 11.146); (3.3, -1.647); ( 3.8,…
A: Find your answer below
Q: Compute r2 and interpret the size of the effect.
A: The data shows that the rating of aggressiveness before participating in the program and after…
Q: To compute a student's Grade Point Average (GPA) for a term, the student's grades for each course…
A: Mean: For a set of n observations, x1, x2, ... , xn with weights w1, w2, … , wn, weighted mean is…
Q: To compute a student's Grade Point Average (GPA) for a term, the student's grades for each course…
A:
Q: how to solve and the answer
A: Given information- The student's grades for each course are weighted by the number of credits for…
Q: To compute a student's Grade Point Average (GPA) for a term, the student's grades for each course…
A:
Q: (a) We wish to test the null hypothesis that the Las Vegas predictions are unbiased. This will…
A:
Q: The stopping distance of an automobile, on dry, level pavement, traveling at a speed v (in…
A: Hello. Since your question has multiple sub-parts, we will solve first three sub-parts for you. If…
Q: Use the data in the given table to fill in the missing coefficients. Round your answers to 3 decimal…
A:
Q: To compute a student's Grade Point Average (GPA) for a term, the student's grades for each course…
A: According to the provided information, Student had these grades:4.0 in a 5 credit Math course2.0 in…
Q: To compute a student's Grade Point Average (GPA) for a term, the student's grades for each course…
A:
Q: 12 Find out the value of A from the following data, and convert this value of Á into student…
A:
Q: A student's grades for a math course are given below. 1. Percentage of Final Grade Student Grade…
A: Solution
Q: Let us measure the degree of relationship between the performance rank obtained by the ten trainees…
A: The data shows the rank evaluation for first and second period.
Q: The numbers of hours spent (per week) on part time jobs by students are shown below. Hours Students…
A: Given data is Hours students 0-9 20 10-19 80 20-29 180 30-39 120
Q: using the data X P (X) 0 0.12 1 0.18 2 0.30 3 0.15…
A: The data shows the values of x and its probabilities.
Q: To compute a student's Grade Point Average (GPA) for a term, the student's grades for each course…
A: Math course 3.7 5 18.5 Music course 2.6 3 7.8 Chemistry course 3.1 5 15.5 Journalism course…
Q: The following table shows the hot dogs bought from a street vendor over the course of eight days…
A: We know that, F= MSR/MSE Where MSR= SSR/d.f.(R) MSE= SSE/d.f.(E) Here sample size, n= 7 and k= 2
Q: To compute a student's Grade Point Average (GPA) for a term, the student's grades for each course…
A:
Q: To compute a student's Grade Point Average (GPA) for a term, the student's grades for each course…
A: The weighted average is defined as, where wi is the weight, and xi is the frequency corresponding…
Q: 18 What is the value of g? Show all your work! Enter only numerical values. S (3 Points) 1440 56°…
A: We can use property of parallel lines. In order to solve this question.
Q: The table below shows the relationship between the altitude of the atmosphere and corresponding…
A: Given that, the relationship between the altitude of the atmosphere and corresponding temperature.…
Q: A study is being made of the failures of an electronic component. There are four types of failures…
A: The following information has been given: A B C D Total 1 22 46 18 9 95 2 4 17 6 12 39…
Q: Note that TSS, SSB, and SSW are all measures of variation. a. True or false: SSB, SSW, and TSS are…
A: (a) SSB , SSW, TSS are always non negative because all are sum of squares of respective values.…
Q: To compute a student's Grade Point Average (GPA) for a term, the student's grades for each course…
A: A fraction is a number in the form xy (where x and y are both integers and y ≠ 0). In the above…
Q: To compute a student's Grade Point Average (GPA) for a term, the student's grades for each course…
A: Given information- We have given the student's grades for each course are weighted by the number of…
Q: Use the output provided in the formula sheets folder. In testing if the reduced model is useful, the…
A: Given two tables for ANOVA and coefficients, and F statistics is Fcal=13.58
Q: Day I 2 3 4 5 6 7 Ice cream Temp oC 14.2 16.4 l l.9 15.2 18.5 22.1 19.4 Sales (N$) 215 325 185 332…
A: Given : Day I 2 3 4 5 6 7Ice cream Temp oC 14.2 16.4 l l.9 15.2 18.5 22.1 19.4Sales (N$) 215 325 185…
39a
|

Step by step
Solved in 2 steps


- Calculate Pearson’s coefficient of skewness. Hence, describe the shape of thedistribution of the waiting time for counter A and B.Dr. Dommer is interested in testing whether the gender breakdown in his introductory biology class isrepresentative of the gender breakdown of the college population. There are 20 females and 25 males in his class. If the college population is 60 percent female, what should Dr. Dommer conclude about the representativeness of his class? Complete the 6 steps of hypothesis testing. Show your work for each step. Report your results and conclusion in APA style. Assume that alpha is set at .05.The Engineering group performed a factorial experiment to investigate the effect of paint primer type and application method on paint adhesion. The results for each combination of primer type and application method are shown below. Each combination has three specimens painted, then a finish paint was applied, and the adhesion force was measured. Compute for the following: (1) Sum of Squares, Degrees of Freedom, (3) Mean Square, (4) fo, and (5) P-Value for; (a) Primer types, (b) Application methods, (c) Interaction, (d) Error, and (e) Total. Write your complete solution and create a table for the results ANSWER C,D,E
- The Engineering group performed a factorial experiment to investigate the effect of paint primer type and application method on paint adhesion. The results for each combination of primer type and application method are shown below. Each combination has three specimens painted, then a finish paint was applied, and the adhesion force was measured. Compute for the following: (1) Sum of Squares, Degrees of Freedom, (3) Mean Square, (4) fo, and (5) P-Value for; (a) Primer types, (b) Application methods, (c) Interaction, (d) Error, and (e) Total. Write your complete solution and create a table for the results ANSWER 1,2,3,4Makers of generic drugs are required to show that their generic drugs do not differ significantly from the “reference” or brand name drugs that they imitate. One aspect in which the generic drugs might differ is their extent of absorption in the blood. Twelve subjects were available for the study. Six were randomly selected to receive the generic drug first and then, after a washout period, receive the “reference” drug. The remaining six received the “reference” drug first, followed by the generic drug after the washout period. Suppose the t test statistic is t = 1.72. What is the p-value for a two-sided test? Group of answer choices 0.05 < p-value < 0.10 0.40 < p-value < 0.50 0.20 < p-value < 0.25 0.10 < p-value < 0.20A researcher is interested in studying the effects of altitude on cognitive performance (e.g., perception, memory, problem solving, etc.). The researcher finds a group of experienced mountain climbers (n = 10) who volunteer to participate in the study. All of the climbers are tested at three different altitudes—at sea level (in the researchers’ laboratory at the University of California, San Diego), at the base camp (9,000 feet above sea level), and at 23,000 feet above sea level (at the peak of Mt. Denali in Alaska). At each location, the climbers perform a memory task (remember a list of 16 non-words like “biv”), and the accuracy of their memory is recorded (i.e., # of correctly recalled words). a. pls name the independent variable, dependent variable, levels of the IV, and the type of experiment design of this study (i.e., b/w- or w/i-subject design ) b. on what level of measurement is accuracy of memory assessed? (i.e., is it on nominal, ordinal, interval, or ratio?
- A researcher is interested in studying the effects of altitude on cognitive performance (e.g., perception, memory, problem solving, etc.). The researcher finds a group of experienced mountain climbers (n = 10) who volunteer to participate in the study. All of the climbers are tested at three different altitudes—at sea level (in the researchers’ laboratory at the University of California, San Diego), at the base camp (9,000 feet above sea level), and at 23,000 feet above sea level (at the peak of Mt. Denali in Alaska). At each location, the climbers perform a memory task (remember a list of 16 non-words like “biv”), and the accuracy of their memory is recorded (i.e., # of correctly recalled words). a. pls name the independent variable, dependent variable, levels of the IV, and the type of experiment design of this study (i.e., b/w- or w/i-subject design ) b. on what level of measurement is accuracy of memory assessed? (i.e., is it on nominal, ordinal, interval, or ratio?) View…The data in the table below presents the hourly quantity of production for three lines of production processes over the first 4 days in XYZ Company. Answer the questions based on the Excel Output given in the image. a. State the null and alternative hypothesis for single factor ANOVA. b. State the decision rule (α = 0.05).c. Calculate the test statistic and make a decision.An analysis was conducted by the Statistics Consulting Center atVirginia Polytechnic Institute and State University in which acertain treatment was applied to a set of tree stumps. The chemicalGarlon was used the with the purpose of regenerating the roots ofthe stumps. A spray was used with four levels of GarlonPage 23 of 23concentration. After a period of time the height of the shoots wasobserved. Does the concentration of Garlon has a significantimpact on the height of the shoots? Use α = 0.05.