(Profitability Ratio) What is the Price Earnings Ratio in 2020?

Cornerstones of Financial Accounting
4th Edition
ISBN:9781337690881
Author:Jay Rich, Jeff Jones
Publisher:Jay Rich, Jeff Jones
Chapter10: Stockholder's Equity
Section: Chapter Questions
Problem 27CE: Calculating the Number of Shares Issued Castalia Inc. issued shares of its $0.80 par value common...

Related questions
Question
(Profitability Ratio)
What is the Price Earnings Ratio in 2020?
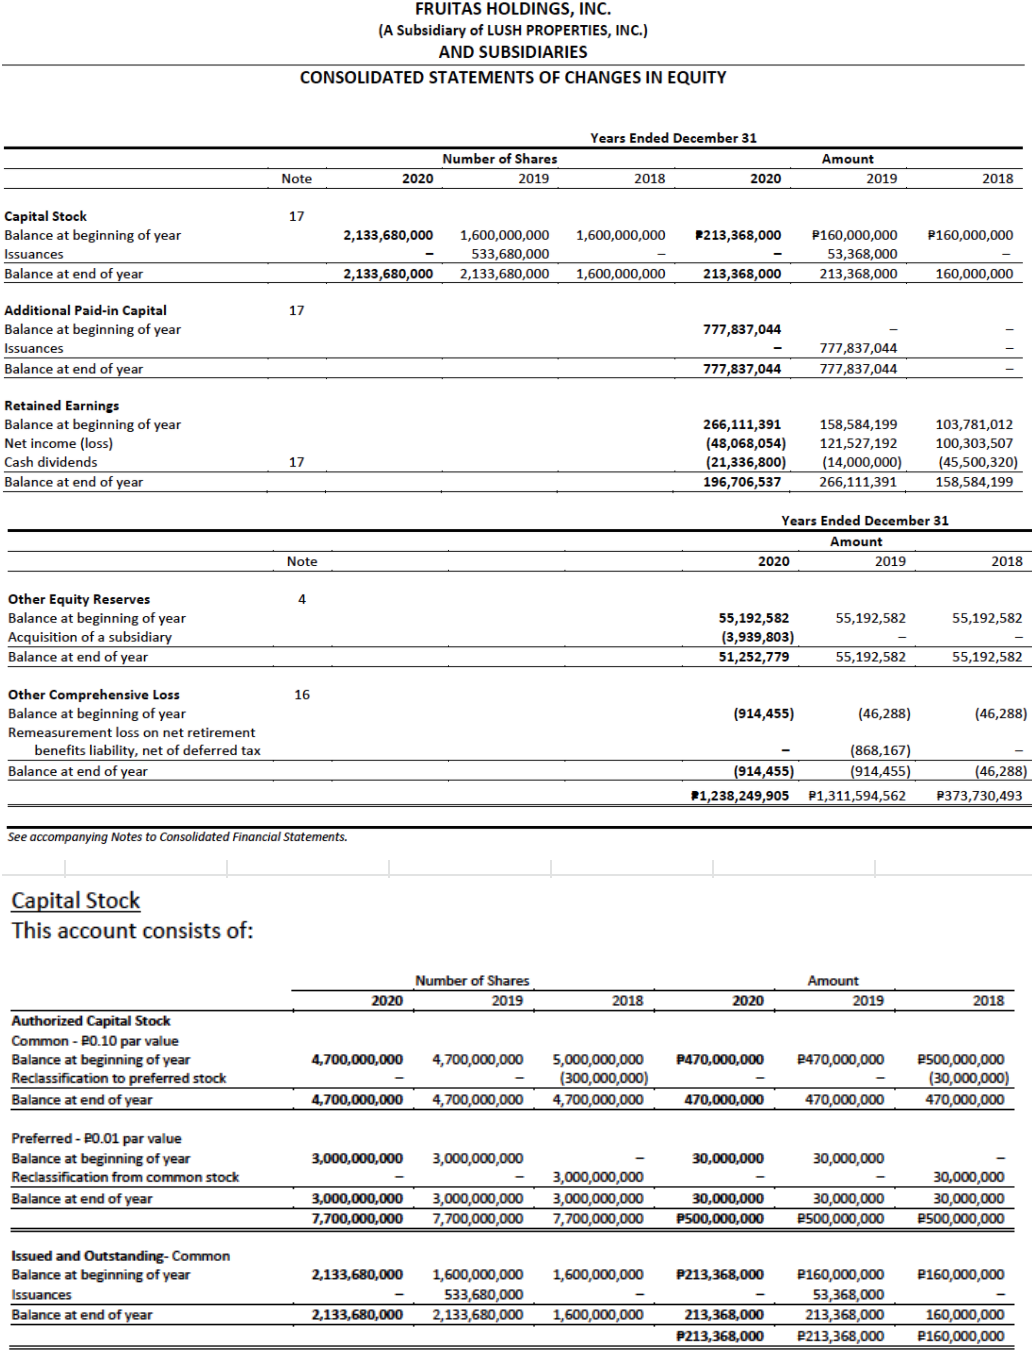
Transcribed Image Text:FRUITAS HOLDINGS, INC.
(A Subsidiary of LUSH PROPERTIES, INC.)
AND SUBSIDIARIES
CONSOLIDATED STATEMENTS OF CHANGES IN EQUITY
Years Ended December 31
Number of Shares
Amount
Note
2020
2019
2018
2020
2019
2018
Capital Stock
Balance at beginning of year
17
1,600,000,000
533,680,000
P160,000,000
53,368,000
2,133,680,000
1,600,000,000
P213,368,000
P160,000,000
Issuances
Balance at end of year
2,133,680,000
2,133,680.000
1.600.000.000
213,368,000
213,368,000
160,000,000
Additional Paid-in Capital
Balance at beginning of year
17
7,044 83,ררר
Issuances
777,837,044
Balance at end of year
7,044ו,777
777,837,044
Retained Earnings
Balance at beginning of year
Net income (loss)
266,111,391
(48,068,054)
(21,336,800)
196,706,537
158,584,199
103,781,012
121,527,192
100,303,507
Cash dividends
17
(14,000,00
(45,500,320)
Balance at end of year
266,111,391
158,584,199
Years Ended December 31
Amount
Note
2020
2019
2018
Other Equity Reserves
Balance at beginning of year
Acquisition of a subsidiary
Balance at end of year
4.
55,192,582
(3,939,803)
55,192,582
55,192,582
51,252,779
55,192,582
55,192,582
Other Comprehensive Loss
Balance at beginning of year
16
(914,455)
(46,288)
(46,288)
Remeasurement loss on net retirement
benefits liability, net of deferred tax
Balance at end of year
(868,167)
(914,455)
(914,455)
(46,288)
P1,238,249,905
P1,311,594,562
P373,730,493
See accompanying Notes to Consolidated Financial Statements.
Capital Stock
This account consists of:
Number of Shares
Amount
2020
2019
2018
2020
2019
2018
Authorized Capital Stock
Common - P0.10 par value
Balance at beginning of year
5,000,000,000
(300,000,000)
4,700,000,000
4,700,000,000
4,700,000,000
P470,000,000
P470,000,000
P500,000,000
(30,000,000)
Reclassification to preferred stock
Balance at end of year
4,700,000,000
4,700,000,000
470,000,000
470,000,000
470,000,000
Preferred - PO.01 par value
Balance at beginning of year
3,000,000,000
3,000,000,000
30,000,000
30,000,000
3,000,000,000
3,000,000,000
7,700,000,000
Reclassification from common stock
30,000,000
3,000,000,000
7,700,000,000
30,000,000
P500,000,000
Balance at end of year
30,000,000
P500,000,000
3,000,000,000
30,000,000
7,700,000,000
P500,000,000
Issued and Outstanding- Common
Balance at beginning of year
P160,000,000
1,600,000,000
533,680,000
2,133,680,000
1,600,000,000
P213,368,000
P160,000,000
Issuances
53,368,000
160,000,000
P160,000,000
Balance at end of year
2,133,680,000
2,133,680,000
1,600,000,000
213,368,000
213,368,000
P213,368,000
P213,368,000
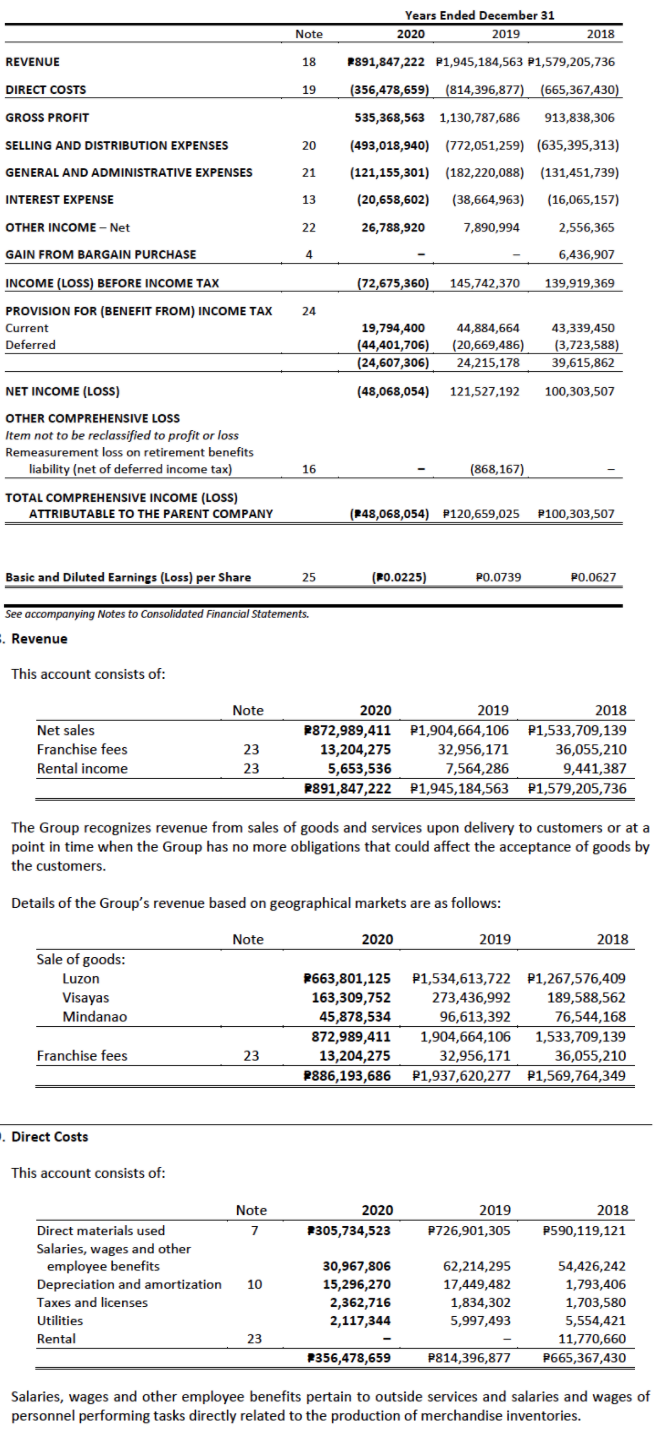
Transcribed Image Text:Years Ended December 31
Note
2020
2019
2018
REVENUE
18
P891,847,222 P1,945,184,563 P1,579,205,736
DIRECT COSTS
19
(356,478,659) (814,396,877) (665,367,430)
GROSS PROFIT
535,368,563 1,130,787,686
913,838,306
SELLING AND DISTRIBUTION EXPENSES
20
(493,018,940)
(772,051,259) (635,395,313)
GENERAL AND ADMINISTRATIVE EXPENSES
21
(121,155,301)
(182,220,088)
(131,451,739)
INTEREST EXPENSE
13
(20,658,602)
(38,664,963)
(16,065,157)
OTHER INCOME – Net
22
26,788,920
7,890,994
2,556,365
GAIN FROM BARGAIN PURCHASE
4
6,436,907
INCOME (LOSS) BEFORE INCOME TAX
(72,675,360)
145,742,370
139,919,369
PROVISION FOR (BENEFIT FROM) INCOME TAX
24
Current
19,794,400
(44,401,706)
44,884,664
43,339,450
(20,669,486)
24,215,178
Deferred
(3,723,588)
(24,607,306)
39,615,862
NET INCOME (LOSS)
(48,068,054)
121,527,192
100,303,507
OTHER COMPREHENSIVE LOSS
Item not to be reclassified to profit or loss
Remeasurement loss on retirement benefits
liability (net of deferred income tax)
16
(868,167)
TOTAL COMPREHENSIVE INCOME (LOSS)
ATTRIBUTABLE TO THE PARENT COMPANY
(248,068,054) P120,659,025
P100,303,507
Basic and Diluted Earnings (Loss) per Share
25
(P0.0225)
PO.0739
PO.0627
See accompanying Notes to Consolidated Financial Statements.
: Revenue
This account consists of:
Note
2020
2019
2018
Net sales
P872,989,411
13,204,275
5,653,536
P1,904,664,106
P1,533,709,139
Franchise fees
23
32,956,171
36,055,210
Rental income
23
7,564,286
9,441,387
P891,847,222 P1,945,184,563
P1,579,205,736
The Group recognizes revenue from sales of goods and services upon delivery to customers or at a
point in time when the Group has no more obligations that could affect the acceptance of goods by
the customers.
Details of the Group's revenue based on geographical markets are as follows:
Note
2020
2019
2018
Sale of goods:
Luzon
P663,801,125
163,309,752
45,878,534
P1,534,613,722 P1,267,576,409
273,436,992
96,613,392
Visayas
189,588,562
Mindanao
76,544,168
872,989,411
1,904,664,106
1,533,709,139
Franchise fees
23
32,956,171
P1,937,620,277 P1,569,764,349
13,204,275
36,055,210
P886,193,686
. Direct Costs
This account consists of:
Note
2020
2019
2018
Direct materials used
7
2305,734,523
P726,901,305
P590,119,121
Salaries, wages and other
employee benefits
Depreciation and amortization
30,967,806
62,214,295
54,426,242
1,793,406
1,703,580
10
15,296,270
17,449,482
2,362,716
2,117,344
Taxes and licenses
1,834,302
Utilities
5,997,493
5,554,421
Rental
23
11,770,660
2356,478,659
P814,396,877
P665,367,430
Salaries, wages and other employee benefits pertain to outside services and salaries and wages of
personnel performing tasks directly related to the production of merchandise inventories.
Expert Solution
This question has been solved!
Explore an expertly crafted, step-by-step solution for a thorough understanding of key concepts.

Step by step
Solved in 2 steps with 1 images

Knowledge Booster


Learn more about
Need a deep-dive on the concept behind this application? Look no further. Learn more about this topic, accounting and related others by exploring similar questions and additional content below.Recommended textbooks for you
Cornerstones of Financial Accounting
Accounting
ISBN:
9781337690881
Author:
Jay Rich, Jeff Jones
Publisher:
Cengage Learning

Intermediate Accounting: Reporting And Analysis
Accounting
ISBN:
9781337788281
Author:
James M. Wahlen, Jefferson P. Jones, Donald Pagach
Publisher:
Cengage Learning

Financial Accounting: The Impact on Decision Make…
Accounting
ISBN:
9781305654174
Author:
Gary A. Porter, Curtis L. Norton
Publisher:
Cengage Learning
Cornerstones of Financial Accounting
Accounting
ISBN:
9781337690881
Author:
Jay Rich, Jeff Jones
Publisher:
Cengage Learning
Intermediate Accounting: Reporting And Analysis
Accounting
ISBN:
9781337788281
Author:
James M. Wahlen, Jefferson P. Jones, Donald Pagach
Publisher:
Cengage Learning
Financial Accounting: The Impact on Decision Make…
Accounting
ISBN:
9781305654174
Author:
Gary A. Porter, Curtis L. Norton
Publisher:
Cengage Learning

Managerial Accounting
Accounting
ISBN:
9781337912020
Author:
Carl Warren, Ph.d. Cma William B. Tayler
Publisher:
South-Western College Pub

Survey of Accounting (Accounting I)
Accounting
ISBN:
9781305961883
Author:
Carl Warren
Publisher:
Cengage Learning

College Accounting, Chapters 1-27
Accounting
ISBN:
9781337794756
Author:
HEINTZ, James A.
Publisher:
Cengage Learning,