

Q: Using the NPV index approach to ranking projects, which projects should the firm accept? * A firm…
A: In the given case the company should select project 1,6,5,3 since it yields better results compared…
Q: what is the net present value of the project?
A: Net Present Value: It is a measure of absolute profitability used in capital budgeting. Thus, it is…
Q: million investment today and have expected NPVs of $600,000. Management conducted a full risk…
A: Beta and standard deviation are used to calculate the risk level of a portfolio or fund.Standard…
Q: A company estimates that its average-risk projects have a WACC of 10%, its below-average risk…
A: WACC of below average risk project = 8% WACC of average risk project = 10% WACC of above average…
Q: Suppose your firm is considering investing in a project with the cash flows shown below, that the…
A:
Q: You are a consultant to a firm evaluating an expansion of its current business. The cash-flow…
A: Formulas:
Q: You are a consultant to a firm evaluating an expansion of its current business. The cash-flow…
A: Here, Beta of the Firm is 1.2 Expected Return of Market Portfolio is 15% Risk-Free Rate is 4%…
Q: Tomodachi Co plans to invest in either Projects M or N which are described below. The company's cost…
A: “Since you have asked multiple questions, we will solve the first question for you. If you want any…
Q: Suppose your firm is considering investing in a project with the cash flows shown below, that the…
A: NPV can be calculated by following function in excel =NPV(rate,value1,[value2],…) + Initial…
Q: You are a consultant to a firm evaluating an expansion of its current business. The cash-flow…
A: Given:
Q: 'ou are a consultant to a firm evaluating an expansion of its current business. The cash-flow…
A: Net present value is difference between present value cash flow and initial investment.
Q: An all-equity firm is considering the projects shown below. The T-bill rate is 3 percent and the…
A: Project specific benchmarks refers to the project specific required return. It can be calculated…
Q: Suppose your firm is considering investing in a project with the cash flows shown below, that the…
A: The net present value is the excess of present value of cash inflows over the present value of cash…
Q: Suppose your firm is evaluating four potential new investments. You calculate that these projects,…
A: Independent projects are those in which acceptance of one project does not affect acceptance or…
Q: Suppose your firm is considering investing in a project with the cash flows shown below, that the…
A: YEAR REQUIRED RETURN 9% 0 -7100 1 1100 2 2300 3 1500 4 1500 5 1300 6 1100
Q: Oman Aluminium Company is trying to introduce an improved method of assessing investment projects…
A: 1. CAPM: Cost of equity = Risk free rate + (Beta*Market risk premium) Cost of equity = 6% +…
Q: Consider the case of another company. Kim Printing is evaluating two mutually exclusive projects.…
A: given, risk measure project A project B STANDARD DEVIATION $80,000 $120,000 PROJECT BETA…
Q: You are a consultant to a firm evaluating an expansion of its current business. The cash-flow…
A: Initial investment (I) = $100 million Annual cashflow (A) = $15 million n = 10 years Let r = IRR
Q: Suppose your firm is considering investing in a project with the cash flows shown below, that the…
A: Required Return = 7% Year Cash Flow 0 -5300 1 1300 2 2500 3 1700 4 1700 5 1500 6…
Q: Suppose that your bank is considering investing in a one-year project. The investment will cost $10…
A: Both the expected shortfall and VAR are the measures of risk level.
Q: Suppose your firm is considering investing in a project with the cash flows shown below, that the…
A: Calculation of Profitability Index (PI):The profitability index (PI) is 0.92.Excel Spreadsheet:
Q: Suppose your firm is considering investing in a project with the cash flows shown below, that the…
A: Payback Period = Years before full recovery + unrecovered cost at the start of the year / cashflow…
Q: Suppose your firm is considering investing in a project with the cash flows shown below, that the…
A: NPV is the difference between present value of cahs outflow and present value of cashinflows.…
Q: Suppose your firm is considering investing in a project with the cash flows shown below, that the…
A: Calculation of NPV:The NPV is $968.66.Since the NPV of the project is positive, this project can be…
Q: . Oman Aluminium Company is trying to introduce an improved method of assessing investment projects…
A: WACC is estimated cost incurred by an entity to finance capital structure. IT is computed by…
Q: Suppose your firm is considering investing in a project with the cash flows shown below, that the…
A: Calculation of Payback Period:The payback period is 2.70 years.The project should be Rejected since…
Q: Mantap Industries has three projects under consideration. Project L is a lower-than-averagerisk…
A: Computation of cost of equity for each project: Hence, the cost of equity of project L, A and H are…
Q: You are a consultant to a firm evaluating an expansion of its current business. The cash-flow…
A: Answer and calculations are given below
Q: An all-equity firm is considering the following projects: Project Beta IRR W .67 9.5 % X…
A: We have to calculate expected return using CAPM formula.
Q: Accra Hearts of Oak FC Ltd wants to invest in two projects, namely, A & B. The expected return on…
A: Expected return of A (Ra) = 20% Expected return of B (Rb) = 50% Risk of A (Sa) = 13% Risk of B (Sb)…
Q: Suppose your firm is considering investing in a project with the cash flows shown below, that the…
A: YEAR CASH FLOW 0 $ (295,000.00) 1 $…
Q: You are a consultant to a firm evaluating an expansion of its current business. The cash-flow…
A: Given: Year Cash Flow 0 -100 1 19 2 19 3 19 4 19 5 19 6 19 7 19 8 19 9 19…
Q: Celestial Crane Cosmetics is analyzing a project that requires an initial investment of $3,225,000.…
A:
Q: Suppose your firm is considering investing in a project with the cash flows shown below, that the…
A: YEAR CASH FLOW REQUIRED RETURN 11% 0 -238000 1 66100 2 84300 3 141300 4 122300 5…
Q: Answer the following lettered questions on the basis of the information in this table: a. If the…
A: a. If the interest-rate cost of funds is 8 percent, what will be the optimal amount of R&D…
Q: The Curry Company is analyzing two capital investments. The financial vice president insists on…
A: Company should chose Project Y.
Q: Suppose your firm is considering investing in a project with the cash flows shown below, that the…
A: PI ( Profitability index) = Present value of future cash flows / Initial Investment Discounted…
Q: Your firm is planning to invest in an automated packaging plant. Harburtin Industries is an…
A: Since we only answer up to 3 sub-parts, we’ll answer the first 3. Please resubmit the question and…
Q: Beta of a project. Magellan is adding a project to the company portfolio and has the following…
A: IF CAPM holds good, Expected Return of Project = Risk-free rate + (Expected market - Risk Free…
Q: Midwest Water Works estimates that its WACC is 10.5%. The company is considering the following…
A: The calculation is:
Q: 2. Assume that the Treasury bill rate is 3 percent and the expected return on the market portfolio…
A: Investment Strategy refers to a planned path that is followed in selection of different projects or…
Q: Huang Industries is considering a proposed project whose estimated NPV is $12 million. This estimate…
A: Given, The NPV of the project with different probabilities.
Q: Oman Aluminium Company is trying to introduce an improved method of assessing investment projects…
A: WACC is the sum of costs of different sources of finance weighted by their proportions in the total…
Q: A plan sponsor is considering two U.K. investment managers, Birmingham Asset Management and Figleaf…
A: Birmingham Asset Management Average Value Added Return = 1.7% Variability of Excess Return = 2.20%…
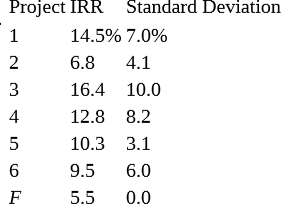
A firm wants to select one new research and development project. The following table summarizes six possibilities. Considering expected return and risk, which projects are good candidates? The firm believes it can earn 5.5% on a risk-free investment in government securities (labeled as Project F).


Trending now
This is a popular solution!

Step by step
Solved in 3 steps with 3 images


- coefficient variation=.55 positive coeficient of correlation =.20 expected value=$1200 What does standard deviation equal?Yields Year TLS DI PFE WMT 20x5 12.00% 4.50% 5.80% 11.30% 20x6 13.30% 5.30% 5.70% 9.00% 20x7 10.20% 3.10% 5.90% 13.90% 20x8 9.30% 2.70% 4.50% 14.80% 20x9 8.60% 1.90% 6.30% 15.00% Correlations: CPP = Perfect positive correlation, CP = Perfect correlation, SC = No correlation, CN =Negative correlation, CPN = Perfect negative correlation TLS – DI= 0.996145099 = (CPP) DI – PFE= 0.005359947 = (SC) TLS – PFE= 0.08450695 = (CP) DI – WMT= -0.975050934 = (CPN) TLS – WMT= -0.986408221 = (CPN) PFE – WMT= -0.144303856 = (CN) b. Which three of the four stocks would you combine to build a diversified portfolio and why? It starts from the premise that there is an investment distribution in equal parts (33.3%) among the selected shares. c. Calculate the return, risk and coefficient of variation for the portfolio of three stocks selected in the previous exercise. It starts from the premise that there is an…What is the variance of the following returns? State probability return Boom .2 .75 normal .55 .25 recession .15 -.1 depression .1 -.5 a. .0413 b. .01239 c. .1944 d. .2601 e. .3519
- Part a State Pr(a) ra Pr(b) rb 1 0.2 10% 0.25 12% 2 0.6 15% 0.40 20% 3 0.2 20% 0.35 18% Given the probability distribution above, determine (Calculate) and compare the: Expected return (means) Variance Standard deviation Part b How important is risk to returns and what are the key elements that must be analyzed in this regard before an investment decision is made? Discuss in no more than 200 words.T-Bills Philips Pay-up Rubber-Made Market Index Mean 7.00% 16.90% 2.07% 19.60% 15.00% Variance 0.00% 5.50% 2.40% 3.60% 3.10% Standard deviation 0.00% 23.40% 15.60% 18.90% 17.70% coefficient of variation 0 0.32 1.18 0.18 0.21 Covariance with MP 0 0.04 -0.03 0.02 0.03 Beta 0 1.32 -0.88 0.74 1 CAPM return 7.00% 17.54% -0.02% 12.89% 15.00% Correleation with market index 0.9953 -0.9953 0.6894 1 Mean 7.00% 16.90% 2.07% 19.60% 15.00% Valuation Overvalued (CAPM Above Benchmark) Undervalued (CAPM Below Benchmark) Undervalued ( CAPM Below Benchmark) Fairly priced (Benchmark) Nature of stock Aggressive (Beta is above 1) Defensive (Beta is below 1) Defensive (Beta is above 1) Defensive (Beta is 1) C) Indicate which investments will plot on, above and below the SML? d) If an investment’s expected return (mean return) does not plot on the SML, what does it show? Identify undervalued/overvalued investments from the graph10.7 Calculating Returns and Variability Using the following returns, calculate the arithmetic average returns, the variances, and the standard deviations for X and Y: Returns Year X Y 1 12% 14% 2 24 29 3 -27 -33 4 14 17 5 19 37
- Market Data Return Standard Deviation Beta Market Data 0.120 0.200 1.000 Risk-Free Rate 0.025 0.000 0.000 Company Data A B C Alpha 0.015 0.020 -0.005 Beta 1.200 0.800 1.250 Residual standard deviation, σ(e) 0.105 0.195 0.067 Standard Deviation of Excess Return 0.245 0.235 0.210 Required: Using the data above, please solve for the Sharpe Ratio, Treynor's Measure, and Information Ratio. (Use cells A3 to D10 from the given information to complete this question. Negative answers should be input and displayed as a negative values. All other answers should be input and displayed as positive values.) Risk-Adjusted Performance Measures A B C Market Sharpe Ratio Treynor's Measure Information RatioCalculate the standard deviation for the following returns: Year 2017 2018 2019 2020 Return 12.03% -8.24% 1.34% 4.55% Group of answer choices 8.4% 8.1% 7.6% 7.3%Calculate : M2 measure T2 measure Information Ratio (appraisal ratio) Fund Average return Standard Deviation Beta coefficient Unsystematic Risk A 0.240 0.220 0.800 0.017 B 0.200 0.170 0.900 0.450 C 0.290 0.380 1.200 0.074 D 0.260 0.290 1.100 0.026 E 0.180 0.400 0.900 0.121 F 0.320 0.460 1.100 0.153 G 0.250 0.190 0.700 0.120 Market 0.220 0.180 1.000 0.000 Risk free return 0.050 0.000
- 1. Calculate the Expected Return and Risk measured in terms of standard deviation and Variance relating to the following information of a Investment avenue: Return in Percentage: -15-10-5+5+10+15 Probability:.10.15.20.20.25.10Market Data Return Standard Deviation Beta Market Data 0.120 0.200 1.000 Risk-Free Rate 0.025 0.000 0.000 Company Data A B C Alpha 0.015 0.020 -0.005 Beta 1.200 0.800 1.250 Residual standard deviation, σ(e) 0.105 0.195 0.067 Standard Deviation of Excess Return 0.245 0.235 0.210 Required: Using the data above, please solve for the Sharpe Ratio, Treynor's Measure, and Information Ratio.State ofEconomy Probabilityof State Return on AssetDin State Return on AssetEin State Return on AssetFin State Boom 0.35 0.060 0.310 0.25 Normal 0.50 0.060 0.180 0.20 Recession 0.15 0.060 -0.210 0.10 1. Calculate the standard deviation for each security.