
Chapter3: Statistical Tests With Excel
Section: Chapter Questions
Problem 2P

Related questions
Question
a. Provide an image of the completed graph
b. Was the material that you evaluated real gold, or Fool's gold? How do you know?
Transcribed Image Text:Mass would be plotted along the y-axis, and Volume would be plotted along the x-
axis.
Special Instructions (if any)
N/A
Procedure
Exercise 01 - Creating XY Scatter Plot and Linear Regression Analysis
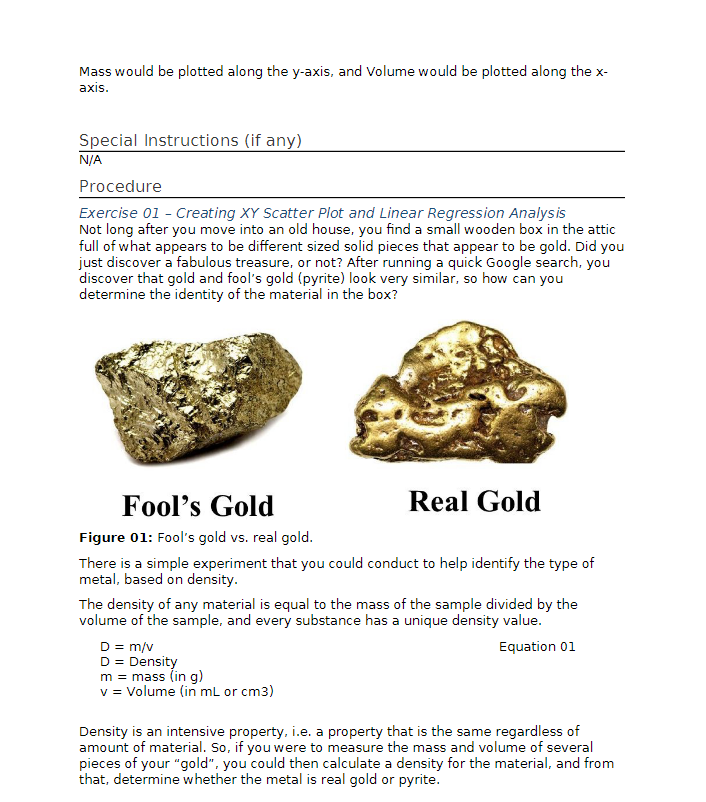
Not long after you move into an old house, you find a small wooden box in the attic
full of what appears to be different sized solid pieces that appear to be gold. Did you
just discover a fabulous treasure, or not? After running a quick Google search, you
discover that gold and fool's gold (pyrite) look very similar, so how can you
determine the identity of the material in the box?
Fool's Gold
Figure 01: Fool's gold vs. real gold.
There is a simple experiment that you could conduct to help identify the type of
metal, based on density.
Real Gold
The density of any material is equal to the mass of the sample divided by the
volume of the sample, and every substance has a unique density value.
Equation 01
D = m/v
D = Density
m = mass (in g)
v = Volume (in mL or cm3)
Density is an intensive property, i.e. a property that is the same regardless of
amount of material. So, if you were to measure the mass and volume of several
pieces of your "gold", you could then calculate a density for the material, and from
that, determine whether the metal is real gold or pyrite.
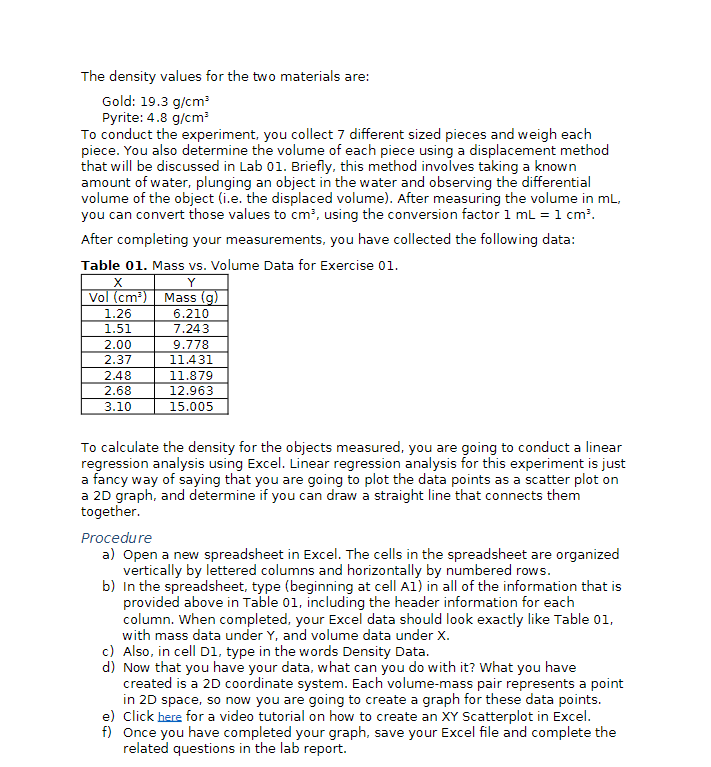
Transcribed Image Text:The density values for the two materials are:
Gold: 19.3 g/cm³
Pyrite: 4.8 g/cm³
To conduct the experiment, you collect 7 different sized pieces and weigh each
piece. You also determine the volume of each piece using a displacement method
that will be discussed in Lab 01. Briefly, this method involves taking a known
amount of water, plunging an object in the water and observing the differential
volume of the object (i.e. the displaced volume). After measuring the volume in mL,
you can convert those values to cm³, using the conversion factor 1 mL = 1 cm³.
After completing your measurements, you have collected the following data:
Table 01. Mass vs. Volume Data for Exercise 01.
Y
Mass (g)
6.210
7.243
X
Vol (cm³)
1.26
1.51
2.00
2.37
2.48
2.68
3.10
9.778
11.431
11.879
12.963
15.005
To calculate the density for the objects measured, you are going to conduct a linear
regression analysis using Excel. Linear regression analysis for this experiment is just
a fancy way of saying that you are going to plot the data points as a scatter plot on
a 2D graph, and determine if you can draw a straight line that connects them
together.
Procedure
a) Open a new spreadsheet in Excel. The cells in the spreadsheet are organized
vertically by lettered columns and horizontally by numbered rows.
b) In the spreadsheet, type (beginning at cell A1) in all of the information that is
provided above in Table 01, including the header information for each
column. When completed, your Excel data should look exactly like Table 01,
with mass data under Y, and volume data under X.
c) Also, in cell D1, type in the words Density Data.
d) Now that you have your data, what can you do with it? What you have
created is a 2D coordinate system. Each volume-mass pair represents a point
in 2D space, so now you are going to create a graph for these data points.
e) Click here for a video tutorial on how to create an XY Scatterplot in Excel.
f) Once you have completed your graph, save your Excel file and complete the
related questions in the lab report.
Expert Solution
This question has been solved!
Explore an expertly crafted, step-by-step solution for a thorough understanding of key concepts.

This is a popular solution!

Trending now
This is a popular solution!

Step by step
Solved in 4 steps with 5 images

Knowledge Booster


Learn more about
Need a deep-dive on the concept behind this application? Look no further. Learn more about this topic, chemistry and related others by exploring similar questions and additional content below.Recommended textbooks for you

Principles of Instrumental Analysis
Chemistry
ISBN:
9781305577213
Author:
Douglas A. Skoog, F. James Holler, Stanley R. Crouch
Publisher:
Cengage Learning
Principles of Instrumental Analysis
Chemistry
ISBN:
9781305577213
Author:
Douglas A. Skoog, F. James Holler, Stanley R. Crouch
Publisher:
Cengage Learning

Chemistry & Chemical Reactivity
Chemistry
ISBN:
9781133949640
Author:
John C. Kotz, Paul M. Treichel, John Townsend, David Treichel
Publisher:
Cengage Learning

Living By Chemistry: First Edition Textbook
Chemistry
ISBN:
9781559539418
Author:
Angelica Stacy
Publisher:
MAC HIGHER