Q 1 - A nation job placement company is interested in developing a model that might be used to explain the variation in starting salaries for college graduates based on the college GPA. through a random sample of the clients with which this company has been associated. The following data were collected |GPA Starting Salary 3.20 $35,000 3.40 $29,500 2.90 $30,000 3.60 $36,400 2.80 $31,500 2.50 $29,000 3.00 $33,200 3.60 $37,600 2.90 $32,000 3.50 $36,000 Based on this sample information: (a). Calculate the correlation coefficient between these two variables. (b). Conduct a test of hypothesis to determine if there exists a correlation between the two variables in the population. Use a significance level of 0.05. determine the least squares regression model. Also, develop a scatter plot of the data and locate the regression line on the scatter plot. (c).
Q 1 - A nation job placement company is interested in developing a model that might be used to explain the variation in starting salaries for college graduates based on the college GPA. through a random sample of the clients with which this company has been associated. The following data were collected |GPA Starting Salary 3.20 $35,000 3.40 $29,500 2.90 $30,000 3.60 $36,400 2.80 $31,500 2.50 $29,000 3.00 $33,200 3.60 $37,600 2.90 $32,000 3.50 $36,000 Based on this sample information: (a). Calculate the correlation coefficient between these two variables. (b). Conduct a test of hypothesis to determine if there exists a correlation between the two variables in the population. Use a significance level of 0.05. determine the least squares regression model. Also, develop a scatter plot of the data and locate the regression line on the scatter plot. (c).

Holt Mcdougal Larson Pre-algebra: Student Edition 2012
1st Edition
ISBN:9780547587776
Author:HOLT MCDOUGAL
Publisher:HOLT MCDOUGAL
Chapter11: Data Analysis And Probability
Section: Chapter Questions
Problem 8CR

Related questions
Question
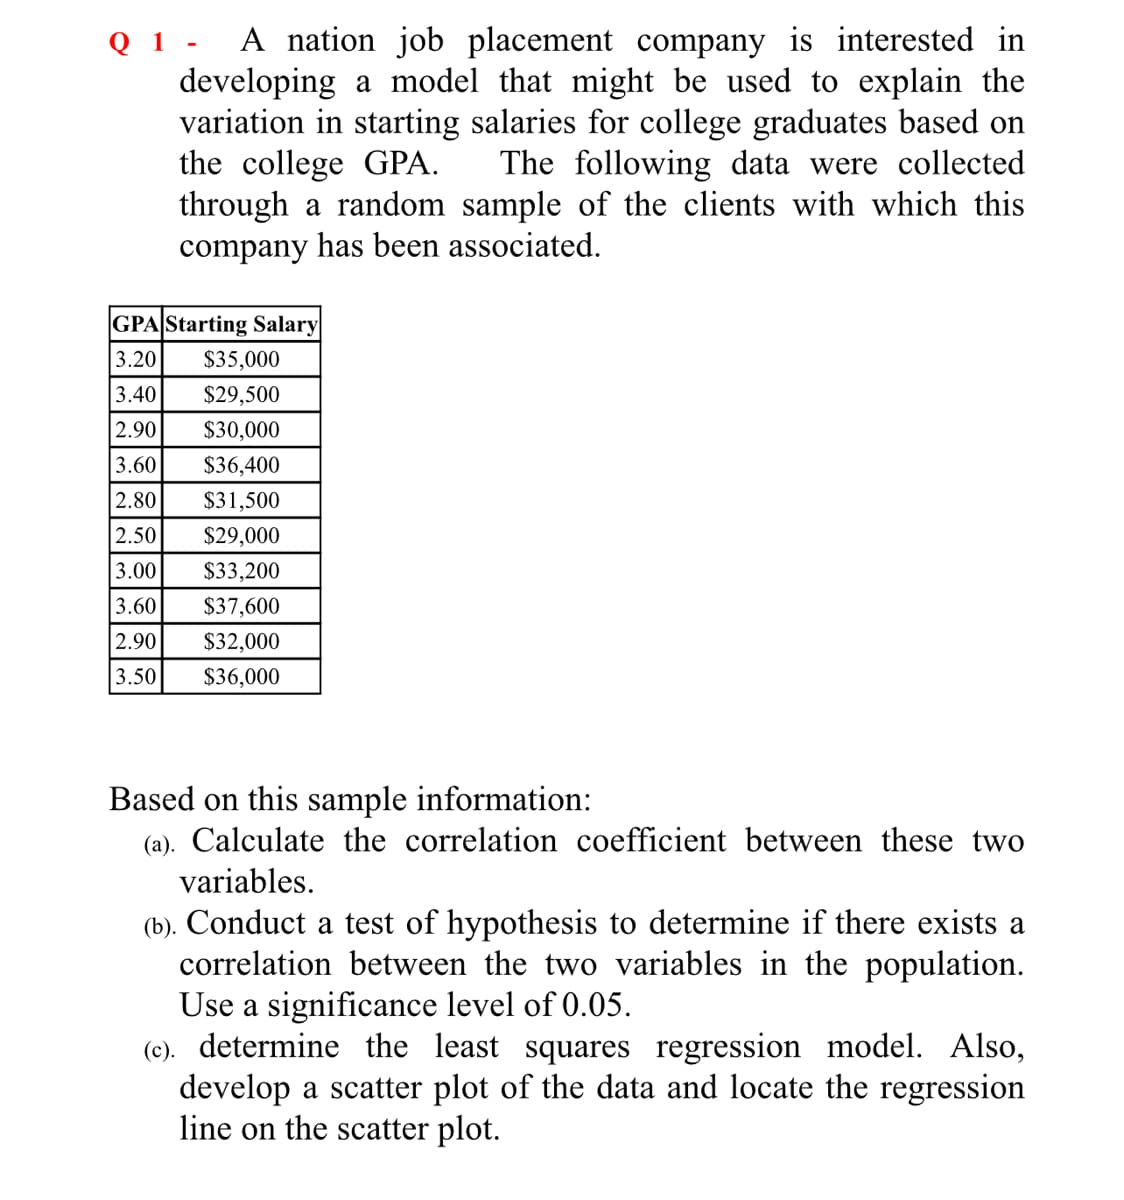
Transcribed Image Text:Q 1 - A nation job placement company is interested in
developing a model that might be used to explain the
variation in starting salaries for college graduates based on
the college GPA.
through a random sample of the clients with which this
company has been associated.
The following data were collected
GPA Starting Salary
3.20
$35,000
3.40
$29,500
2.90
$30,000
3.60
$36,400
2.80
$31,500
2.50
$29,000
3.00
$33,200
3.60
$37,600
2.90
$32,000
3.50
$36,000
Based on this sample information:
(a). Calculate the correlation coefficient between these two
variables.
(b). Conduct a test of hypothesis to determine if there exists a
correlation between the two variables in the population.
Use a significance level of 0.05.
(c). determine the least squares regression model. Also,
develop a scatter plot of the data and locate the regression
line on the scatter plot.
Expert Solution
This question has been solved!
Explore an expertly crafted, step-by-step solution for a thorough understanding of key concepts.

This is a popular solution!

Trending now
This is a popular solution!

Step by step
Solved in 2 steps with 4 images

Recommended textbooks for you
Holt Mcdougal Larson Pre-algebra: Student Edition…
Algebra
ISBN:
9780547587776
Author:
HOLT MCDOUGAL
Publisher:
HOLT MCDOUGAL
Holt Mcdougal Larson Pre-algebra: Student Edition…
Algebra
ISBN:
9780547587776
Author:
HOLT MCDOUGAL
Publisher:
HOLT MCDOUGAL