Q1 Audio Streaming. An audio streaming service offers music and podcasts. Most music is owned by record labels and the streaming service pays a copyright license fee each time a piece of music is streamed. By contrast, the streaming service purchases podcasts outright, paying a flat rate for each edition of the podcast, independent of the number of users that stream it. Forecasts of costs and revenues (from subscriptions and advertising) next year are Normally distributed and are given in the table as a central range within which there is 90% probability. For example, in units of $m, mean value of license fees (24.5 + 27.2)/2 25.85; P(24.5< license fees < 27.2) = 0.9. Cost of license fees ($m) Cost of purchasing podcasts ($m) Revenues (from subscriptions and advertising) |($m) (24.5, 27.2) (1.1, 6.2) (43.9, 51.9) (a) (b) assumption clearly and comment on whether you think it is valid. Are total costs Normally distributed? Give a reason for your answer. What is the coefficient of variation of each of the items in the table? What is the central range within which there is 90% probability for total costs? State your (c) Revenues are related to the number of subscribers, as are licence fee costs, so that they are correlated. Revenues and total costs have a correlation coefficient of 0.58. What is the central range within which there is 90% probability for profits = revenues minus total costs? (d) What is the coefficient of variation of profits?
Q1 Audio Streaming. An audio streaming service offers music and podcasts. Most music is owned by record labels and the streaming service pays a copyright license fee each time a piece of music is streamed. By contrast, the streaming service purchases podcasts outright, paying a flat rate for each edition of the podcast, independent of the number of users that stream it. Forecasts of costs and revenues (from subscriptions and advertising) next year are Normally distributed and are given in the table as a central range within which there is 90% probability. For example, in units of $m, mean value of license fees (24.5 + 27.2)/2 25.85; P(24.5< license fees < 27.2) = 0.9. Cost of license fees ($m) Cost of purchasing podcasts ($m) Revenues (from subscriptions and advertising) |($m) (24.5, 27.2) (1.1, 6.2) (43.9, 51.9) (a) (b) assumption clearly and comment on whether you think it is valid. Are total costs Normally distributed? Give a reason for your answer. What is the coefficient of variation of each of the items in the table? What is the central range within which there is 90% probability for total costs? State your (c) Revenues are related to the number of subscribers, as are licence fee costs, so that they are correlated. Revenues and total costs have a correlation coefficient of 0.58. What is the central range within which there is 90% probability for profits = revenues minus total costs? (d) What is the coefficient of variation of profits?

Practical Management Science
6th Edition
ISBN:9781337406659
Author:WINSTON, Wayne L.
Publisher:WINSTON, Wayne L.
Chapter2: Introduction To Spreadsheet Modeling
Section: Chapter Questions
Problem 20P: Julie James is opening a lemonade stand. She believes the fixed cost per week of running the stand...

Related questions
Question
Part C D
I NEED IN words
not handwritten
Transcribed Image Text:Q1
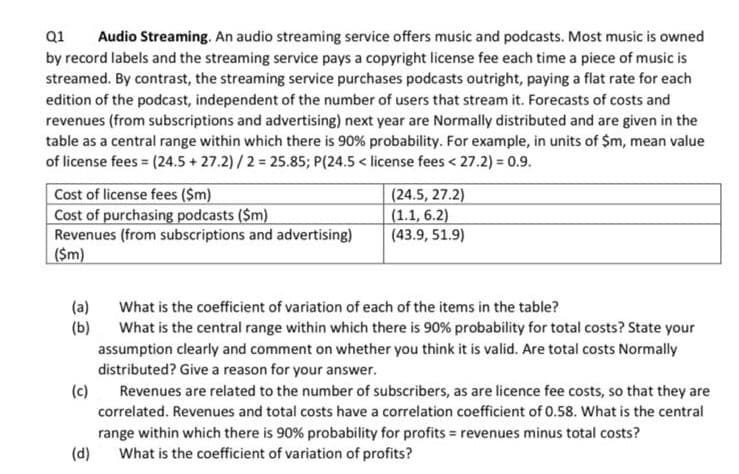
Audio Streaming. An audio streaming service offers music and podcasts. Most music is owned
by record labels and the streaming service pays a copyright license fee each time a piece of music is
streamed. By contrast, the streaming service purchases podcasts outright, paying a flat rate for each
edition of the podcast, independent of the number of users that stream it. Forecasts of costs and
revenues (from subscriptions and advertising) next year are Normally distributed and are given in the
table as a central range within which there is 90% probability. For example, in units of $m, mean value
of license fees = (24.5 + 27.2) /2 = 25.85; P(24.5 < license fees < 27.2) = 0.9.
Cost of license fees ($m)
Cost of purchasing podcasts ($m)
Revenues (from subscriptions and advertising)
($m)
(24.5, 27.2)
(1.1, 6.2)
(43.9, 51.9)
(a)
(b)
What is the coefficient of variation of each of the items in the table?
What is the central range within which there is 90% probability for total costs? State your
assumption clearly and comment on whether you think it is valid. Are total costs Normally
distributed? Give a reason for your answer.
(c)
Revenues are related to the number of subscribers, as are licence fee costs, so that they are
correlated. Revenues and total costs have a correlation coefficient of 0.58. What is the central
range within which there is 90% probability for profits = revenues minus total costs?
(d)
What is the coefficient of variation of profits?
Expert Solution
This question has been solved!
Explore an expertly crafted, step-by-step solution for a thorough understanding of key concepts.

Step by step
Solved in 2 steps with 2 images

Recommended textbooks for you
Practical Management Science
Operations Management
ISBN:
9781337406659
Author:
WINSTON, Wayne L.
Publisher:
Cengage,

Operations Management
Operations Management
ISBN:
9781259667473
Author:
William J Stevenson
Publisher:
McGraw-Hill Education

Operations and Supply Chain Management (Mcgraw-hi…
Operations Management
ISBN:
9781259666100
Author:
F. Robert Jacobs, Richard B Chase
Publisher:
McGraw-Hill Education
Practical Management Science
Operations Management
ISBN:
9781337406659
Author:
WINSTON, Wayne L.
Publisher:
Cengage,
Operations Management
Operations Management
ISBN:
9781259667473
Author:
William J Stevenson
Publisher:
McGraw-Hill Education
Operations and Supply Chain Management (Mcgraw-hi…
Operations Management
ISBN:
9781259666100
Author:
F. Robert Jacobs, Richard B Chase
Publisher:
McGraw-Hill Education


Purchasing and Supply Chain Management
Operations Management
ISBN:
9781285869681
Author:
Robert M. Monczka, Robert B. Handfield, Larry C. Giunipero, James L. Patterson
Publisher:
Cengage Learning

Production and Operations Analysis, Seventh Editi…
Operations Management
ISBN:
9781478623069
Author:
Steven Nahmias, Tava Lennon Olsen
Publisher:
Waveland Press, Inc.