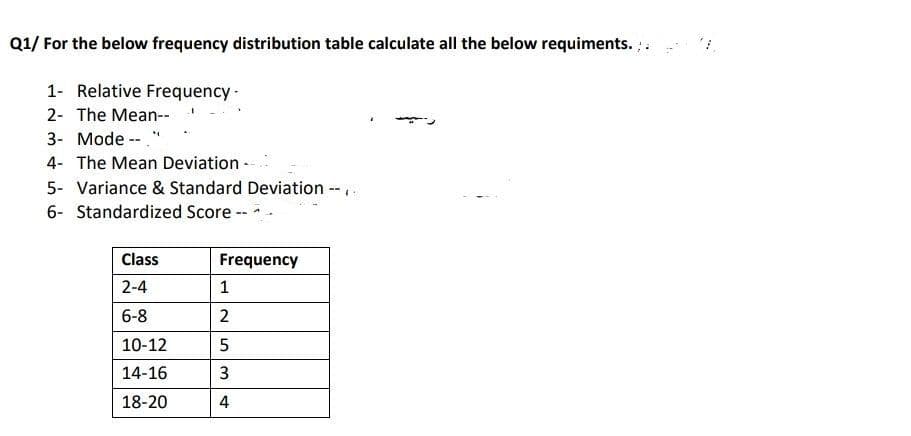
Q1/ For the below frequency distribution table calculate all the below requiments. ;. 1- Relative Frequency - 2- The Mean-- 3- Mode -- ." 4- The Mean Deviation - 5- Variance & Standard Deviation -- 6- Standardized Score -- - Class Frequency 2-4 1 6-8 2 10-12 5 14-16 3 18-20 4


Q: Suppose you know that the value of an investment grows exponentially. Using the exponential curve…
A:
Q: 10. chronological order: 5, 10,-10, 0, 10. Which of the following statements is (are) true? Here are…
A: Economics is a branch of social science that describes and analyzes the behaviors and decisions…
Q: $8 betv its, $18.25
A: We have When Output 7 units Total Cost is $150 Marginal Cost = $8 (between 7th & 8th unit) When…
Q: if v=[4,2,-3] what is the magnitude?
A: The magnitude of a vector is that the length of the vector. The magnitude of the vector a is denoted…
Q: Good day. I got confused about the follow up explanation since it differs from the first one.…
A:
Q: Computer Depot, a national computer retailer, has kept a record of the number af laptop computers…
A: Percentage:(number of days above 40/total days)*100
Q: The Graduate Management Admission Test (GMAT) is a standardized exam used by many universities as…
A: Hey champ,Welcome to this platform. Here you will get the answer with better quality in minimum…
Q: If you are going to design an instrument about the topic "COVID-19: Effects to philippine economy",…
A: Instrument of monetary and fiscal policy for covid-19 effects on Phillipine economy. This instrument…
Q: (a) Construct a relative frequency histogram for the ideal number of children. Choose the correct…
A: Histogram: A histogram is a graphical figure that represents the frequency distribution based on the…
Q: to answer questions 1-4. 1 D 10 15 P75 3.
A: equilibrium is achieved at the output level where Qs=Qd thus equilibrium quantity, Q*=10 units and…
Q: Calculate SP (the sum of products of deviations) for the following scores, Note: Bothmeans are…
A: The values are calculated using the following table x y x⋅y 0 4 0 1 1 1 0 5 0 4 1 4 2 1…
Q: .Search activity occurs when there is a surpius :choose one true O Error O
A: The search activity occurs because of the shortage. In case of the surplus, there is no requirement…
Q: ndard deviation of $5200. What is the probability of a randomly selected new graduate recei ween…
A: DISCLAIMER “Since you have asked multiple question, we will solve the first 3 subparts for you. If…
Q: TEST III. IDENTIFICATION. Identify what type of variable are the following. In your answer sheet,…
A: Nominal variable: The nominal scale brings in variables under different classifications and does not…
Q: The birthweight (in kg of 55 babies are tabulated in the frequency distribution below: Birthweight…
A: Birthweight (kg) Frequency Relative frequency (2-2.5) 11 11/55=0.2 Total n=55 Given:Total…
Q: SPSRS RR S %24 Figure 2-17 10 卫.14 16 12.20 2 Refer to Figure 2-17. The slope of the curve between…
A: Slope of a line is calculated as the change in points on the y-axis by a change in the points on the…
Q: (10+05) The following data were collected on the height (inches) and weight (pounds) of women…
A: Given: Coefficient of determination R2=0.85
Q: Gal 1 2 3 0.1 04 0.3 should the shop expect per hour? pect 2.6 calls per hour. a decimal. Do not…
A: Given, Repair call (x) probability 1 0.1 2 0.4 3 0.3 4 0.2
Q: Question Three a) The following data shows how many employees showed up to work every day for two…
A: Dear Student as you have posted multiple questions here, but we are allowed to answer only 1…
Q: 2. There are known the following data for a company: Indicators (lei) 1 Turnover revenue 70500 83000…
A: The quantity of products sold can also be used to calculate the sales turnover. This can be…
Q: 10 11 800 720 11.5 700 660 12 600 600 12.5 500 850 13.00 400 900
A: (1) At a 11% interest rate, quantity of financial capital demanded is $800 billion and quantity of…
Q: Ody 20 30 30 25
A: The elasticity of demand shows the change in quantity demanded due to a change in the price of the…
Q: anth Sales Forecast 1 Forecast 2 1 770 771 769 2 789 785 787 3 794 790 792 780 784 798 768 770 774…
A: *Answer: Given data Month Sales Forecast1 Forecast 2 1 770 771 769 2 789 785 787 3…
Q: Given the following data set,25, 16, 18,16,20,20,24,30,20,40. What is the mean, median and mode.
A: A measure of central tendency is a single number that attempts to represent a set of data by finding…
Q: The year. 10. Paracetamol and Ibuprofen have the sam patients. "ractice Task #3 Activity 1.3 Are You…
A: Hi! Thank you for the question, As per the honor code, we are allowed to answer three sub-parts at a…
Q: Time Actual (Y) Forecast (Yhat) Forecast Error 100 110 115 120 ? If naïve method is used for the…
A: The forecasted value of time t is the actual value of time t-1. The forecast error is calculated by…
Q: EpidemiologY assignment I 1 Calculate the Following.using the infermation below, - crude death rate…
A: NOTE: Since we only answer up to 3 sub-parts, we’ll answer the first 3. Please resubmit the question…
Q: Q.2. Explain why there must be mistake in the following statement: "A quality control engineer…
A: 2) There are events and probability of occurrence of each event given in the question i.e. number of…
Q: Direction: Complete the table below to find the 60th percentile for the following s of data. Find…
A: Given: Data set 1 Data set 2 Data set 3 20 49 18 22 50 19 25 55 20 32 55 22 35 60 25…
Q: a) Obtain the value of x in the equation: 2x + 1 = e3 (b) Consider the following equation: y…
A: (a) 2x + 1 = e3 Taking 1 on LHS to RHS: 2x =e3 -1 Dividing both the sides by 2: x= (e3 -1 )/2 So,…
Q: Given the following data .Find the OLS estimators using the deviation method. Y 6 10 9 14 7 5 X1…
A: Y X1 X2 6 1 3 10 3 -1 9 2 4 14 -2 6 7 3 2 5 5 4 Using excel, we get the regression…
Q: ear end ash Flow 1 2 3 4 -3,345 1,100 1,100 1,100 1,
A: Assume, CF = Annual cashflow IRR = r n = 4 years
Q: Given: Qd = 800 - 4P Qs = 8P - 400 What is the Arc Elasticity where P = 150 and P = 100?
A: Arc elasticity is the flexibility of one variable as for another between two given focuses. It is…
Q: 2 6. 13 20 Yi 7 18 9 26 23 a. Which of the following scatter diagrams accurately represents the…
A: Answers (A) Option 'b' is correct i.e.,
Q: a) Forecast the company's market share for the 13th quarter by exponential smoothing with w=0.3.
A: Since you have asked multiple questions, we will solve the first question for you. If you want any…
Q: What is meant by the efficiency of an estimator? Which estimator is knownas BLUE?
A: Efficiency - An efficient estimator is the "optimal" estimator of the parameter of interest. So,…
Q: 13. The range of average daily solar radiation over a year is the greatest at the location. a. polar…
A: Economics is a branch of social science that describes and analyzes the behaviors and decisions…
Q: Calculate standard deviation Marks: 0-10,10-20,20-30,30-40,40-50 Frequency :10,15,10,10,5
A: Marks f x fx x (x-x) (x-x)2 f(x-x)2 0-10 10 5 50 14 -9 81 810 10-20 15 10 150 14 -4 16 240…
Q: 4. Researcher is using data for a sample of 100 household to estimate the relation between daily…
A: We have regression equation Y= b0 +b1X
Q: 12. According to the insolation curves, the average daily solar radiation varies the least over the…
A: Economics is a branch of social science that describes and analyzes the behaviors and decisions…
Q: 1. The table below presents hypothetical OLS results with used small SUV price information (in…
A: (a) The predictive equation for the price of small used SUVs areP = 10,000 + 1000*(GN) +500*(GRN) +…
Q: - (2)P Qd = 1100 Qs = 3P I. Given: %3D 100 4. Arc Elasticity where P = 250 and P = 200
A: ANS Elasticity is a measure that gives us an idea about how the quantity (Q) supplied or demanded of…
Q: probability tnat O 0.0555 0.0606 0.340 0.4623
A:
Q: Heights (om) and weights (g) are measured for 100 randomly selected adult males, and range from…
A: Sample size : n = 100 Range for height: 132 cm - 194 cm Range for weight: 40kg - 150kg Yield: x⏞ =…
Q: Find the mean absolute deviation Find the mean absolute deviation 87, 75, 85, 77, 74, 82, 90, 88,…
A: The mean absolute deviation (MAD) is given as: Here, n – Number of observations in dataset xi –…
Q: A health expert evaluates the sleeping patterns of adults. Each week she randomly selects 40 adults…
A: * SOLUTION :-
Q: Solve for x for the following equation: 4ln(3x-8) = 60
A: Answer: Given, 4ln3x-8=60 4ln3x-84=604ln3x-8=153x-8=e153x=e15+8x=e15+83Let us substitute the value…
Q: 6-5 Given: Consider the following time series data. week 1 2 3 4 5…
A: Forecast values are the estimated value for the future period based on the past trend. Forecast…


Step by step
Solved in 2 steps with 2 images


- Calculate SP (the sum of products of deviations) for the following scores, Note: Bothmeans are decimal values, so the computational formula works well.X Y0 41 10 54 12 11 3Given: Qd = 800 - 4P Qs = 8P - 400 What is the Arc Elasticity where P = 150 and P = 100?22 The annual salary of the staff members in a state government agency are shown here. The first column shows the annual salary (S) and the second column the frequency (the number of employees earning that salary) labeled F. The mean salary of agency's staff is: S F $120,000 1 91,000 2 86,000 4 65,000 10 57,500 24 44,000 10 m
- The weekly salary paid to employees of a small company that supplies part-time laborers averages s800 with a standard deviation of $500. (a) If the weekly salaries are normally distributed, estimate the fraction of employees that make more than $300 per week. (b) If every employee receives a year-end bonus that adds $100 to the paycheck in the final week, how does this change the normal model for that week? (c) If every employee receives a 5% salary increase for the next year, how does the normal model change? (d) If the lowest salary is $300 and the meltian salary is $550, does a normal model appear appropriate?1. The table below presents hypothetical OLS results with used small SUV price information (in dollars) as the dependent variable. Assume that the model is correctly specified and a significance level (p-value) of 0.05. Variable Coefficient P-Value Constant 10,000 0.001 SUV is in Good Condition (GC) 1,000 0.030 SUV is Green (GRN) 500 0.040 Miles on the SUV (MGE) -0.005 0.019 Age of the SUV (AGE) -200 0.007 SUV has a Sunroof (SUN) 400 0.045 The number of miles on the SUV and the age in years of the SUV are continuous variables. The rest of the variables are dummy variables. a. Write the predictive equation for the price of small used SUVs in this market. b. According to this model, what is the predicted price of a 6 year old blue SUV in poor condition with 80,000 miles on it and no sunroof? c. According to this model, what is the predicted price of an 8 year old green SUV in good condition with only 30,000 miles on it and a sunroof?please give answer for 7, 8, and 9
- 25) Consider the estimated equation from your textbook = 698.9 - 2.28STR, R2 = 0.051, SER = 18.6, Corresponding standard errors of coefficients are as such: SE (698.9) = 10.4 SE (-2.28) = 0.52 The absolute value of t-statistic for the slope is approximately: A. 67.20 B. 1.76 C. -4.38 D. 0.52How do you solve a problem similar to this? I’m confused on how to solve to find the quantity when you have the other variables. (Q1-15)-Q1/ ((Q1-15)+Q1)/2 = -30.306. Given the following data set,25, 16, 18,16,20,20,24,30,20,40. What is the mean, median and mode. 22.9,20,20 20,26,21 26,20,21
- Calculate standard deviation Marks: 0-10,10-20,20-30,30-40,40-50 Frequency :10,15,10,10,5Probability Possible Rate of Return 0.25 -0.10 0.15 0.00 0.35 0.10 0.25 0.25 a. Under what conditions can the standard deviation be used to measure the relative risk of two investments? b. Under what conditions must the coefficient of variation (CoVar) be used to measure the relative risk of two investments?a. A company produces lightbulbs whose life follows a normal distribution, with mean 1200 hours and standard deviation 250 hours. If we choose a lightbulb at random, what is the probability that its lifetime will be between 900 and 1300 hours? (answer in three decimal places)