Q1: The following frequency distribution represents the amount of sugar in g/l for a sample of bottled drinks: Class Limits Frequency Determine these below: 3.0 -7.0 8.0 - 12.0 13.0-17.0 18.0 22.0 23.0 27.0 28.0 32.0 5 2 8 14 8 1) Sample size. 2) Class width. 3) Scond class midpoint. 4) Lower class boundary for the fourth class. 5) Cumulative frequency for the thirdclass. 6) Cumulative relative frequency for the second class.
Q1: The following frequency distribution represents the amount of sugar in g/l for a sample of bottled drinks: Class Limits Frequency Determine these below: 3.0 -7.0 8.0 - 12.0 13.0-17.0 18.0 22.0 23.0 27.0 28.0 32.0 5 2 8 14 8 1) Sample size. 2) Class width. 3) Scond class midpoint. 4) Lower class boundary for the fourth class. 5) Cumulative frequency for the thirdclass. 6) Cumulative relative frequency for the second class.

Glencoe Algebra 1, Student Edition, 9780079039897, 0079039898, 2018
18th Edition
ISBN:9780079039897
Author:Carter
Publisher:Carter
Chapter10: Statistics
Section10.4: Distributions Of Data
Problem 19PFA

Related questions
Question
100%
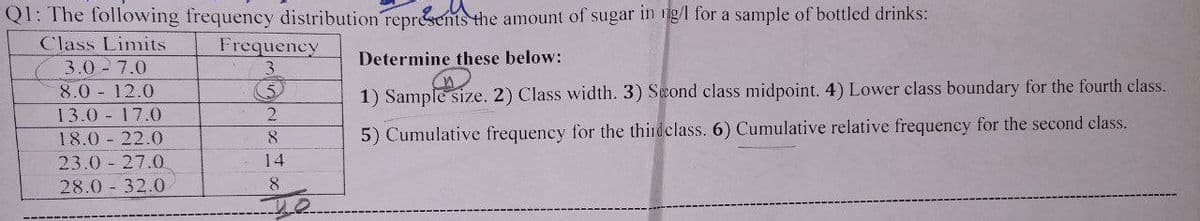
Transcribed Image Text:Q1: The following frequency distribution represents the amount of sugar in g/l for a sample of bottled drinks:
Class Limits
Frequency
Determine these below:
3.0 -7.0
8.0 12.0
13.0 - 17.0
18.0 22.0
23.0-27.0
28.0 32.0
5
2
8
14
8
1) Sample size. 2) Class width. 3) Second class midpoint. 4) Lower class boundary for the fourth class.
plesiz
5) Cumulative frequency for the thirdclass. 6) Cumulative relative frequency for the second class.
Expert Solution
This question has been solved!
Explore an expertly crafted, step-by-step solution for a thorough understanding of key concepts.

Step by step
Solved in 5 steps

Recommended textbooks for you
Glencoe Algebra 1, Student Edition, 9780079039897…
Algebra
ISBN:
9780079039897
Author:
Carter
Publisher:
McGraw Hill
Glencoe Algebra 1, Student Edition, 9780079039897…
Algebra
ISBN:
9780079039897
Author:
Carter
Publisher:
McGraw Hill