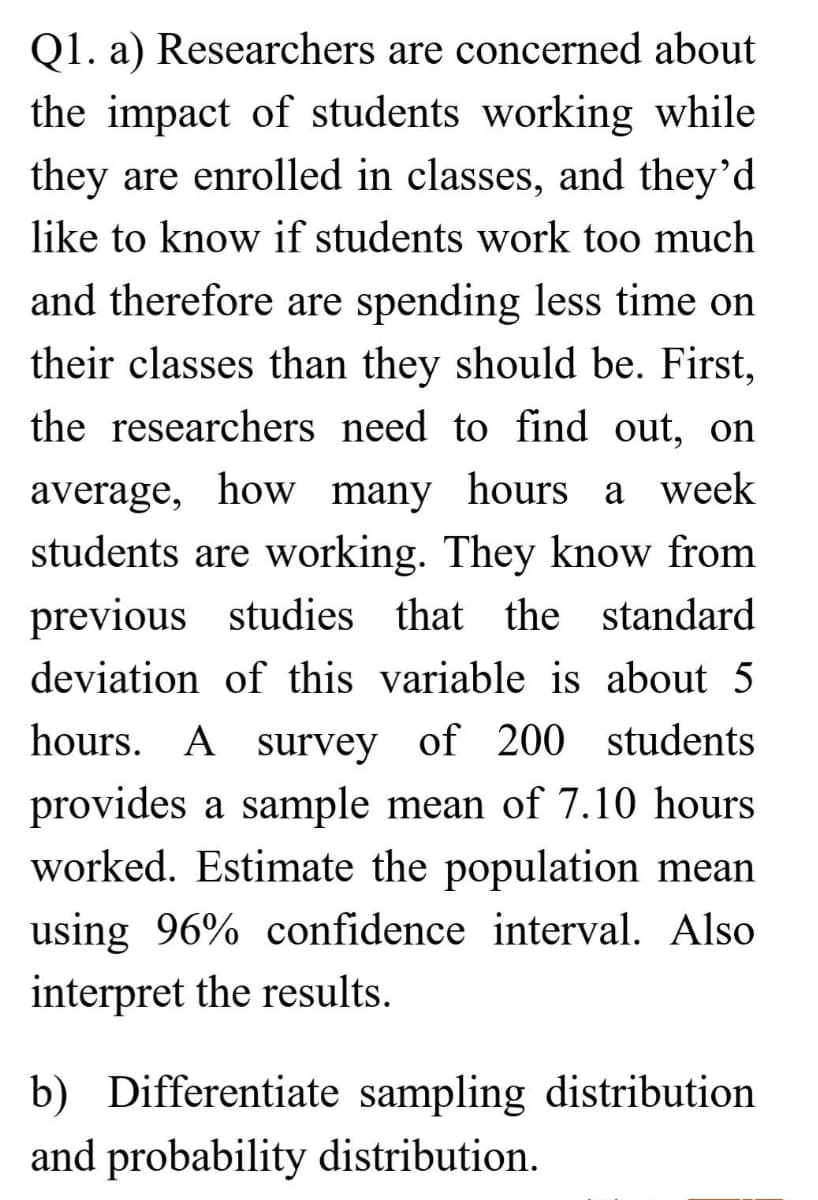
Q1. a) Researchers are concerned about the impact of students working while they are enrolled in classes, and they'd like to know if students work too much and therefore are spending less time on their classes than they should be. First, the researchers need to find out, on average, how many hours a week students are working. They know from previous studies that the standard deviation of this variable is about 5 hours. A survey of 200 students provides a sample mean of 7.10 hours worked. Estimate the population mean using 96% confidence interval. Also interpret the results. b) Differentiate sampling distribution and probability distribution.
Q1. a) Researchers are concerned about the impact of students working while they are enrolled in classes, and they'd like to know if students work too much and therefore are spending less time on their classes than they should be. First, the researchers need to find out, on average, how many hours a week students are working. They know from previous studies that the standard deviation of this variable is about 5 hours. A survey of 200 students provides a sample mean of 7.10 hours worked. Estimate the population mean using 96% confidence interval. Also interpret the results. b) Differentiate sampling distribution and probability distribution.

Linear Algebra: A Modern Introduction
4th Edition
ISBN:9781285463247
Author:David Poole
Publisher:David Poole
Chapter2: Systems Of Linear Equations
Section2.4: Applications
Problem 2EQ: 2. Suppose that in Example 2.27, 400 units of food A, 500 units of B, and 600 units of C are placed...

Related questions

Topic Video
Question
Transcribed Image Text:Q1. a) Researchers are concerned about
the impact of students working while
they are enrolled in classes, and they'd
like to know if students work too much
and therefore are spending less time on
their classes than they should be. First,
the researchers need to find out, on
average, how many hours a week
students are working. They know from
previous studies that the standard
deviation of this variable is about 5
hours. A survey of 200 students
provides a sample mean of 7.10 hours
worked. Estimate the population mean
using 96% confidence interval. Also
interpret the results.
b) Differentiate sampling distribution
and probability distribution.
Expert Solution
This question has been solved!
Explore an expertly crafted, step-by-step solution for a thorough understanding of key concepts.

This is a popular solution!

Trending now
This is a popular solution!

Step by step
Solved in 2 steps

Knowledge Booster


Learn more about
Need a deep-dive on the concept behind this application? Look no further. Learn more about this topic, statistics and related others by exploring similar questions and additional content below.Recommended textbooks for you
Linear Algebra: A Modern Introduction
Algebra
ISBN:
9781285463247
Author:
David Poole
Publisher:
Cengage Learning

Algebra & Trigonometry with Analytic Geometry
Algebra
ISBN:
9781133382119
Author:
Swokowski
Publisher:
Cengage

Linear Algebra: A Modern Introduction
Algebra
ISBN:
9781285463247
Author:
David Poole
Publisher:
Cengage Learning
Algebra & Trigonometry with Analytic Geometry
Algebra
ISBN:
9781133382119
Author:
Swokowski
Publisher:
Cengage