Q18. If x~N(100, 25) and a random sample of x of size 16 is obtained. What is the standard deviation of the distribution of the sample mean, x? A. 1.25 B V1.25 C. 25 D. V25 = 5
Q18. If x~N(100, 25) and a random sample of x of size 16 is obtained. What is the standard deviation of the distribution of the sample mean, x? A. 1.25 B V1.25 C. 25 D. V25 = 5

Glencoe Algebra 1, Student Edition, 9780079039897, 0079039898, 2018
18th Edition
ISBN:9780079039897
Author:Carter
Publisher:Carter
Chapter10: Statistics
Section10.4: Distributions Of Data
Problem 19PFA

Related questions
Question
18
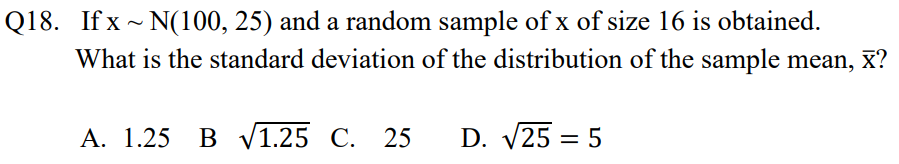
Transcribed Image Text:Q18. If x ~ N(100, 25) and a random sample of x of size 16 is obtained.
What is the standard deviation of the distribution of the sample mean,
x?
A. 1.25 B V1.25 C. 25
D. V25 = 5
Expert Solution
This question has been solved!
Explore an expertly crafted, step-by-step solution for a thorough understanding of key concepts.

Step by step
Solved in 2 steps with 2 images

Recommended textbooks for you
Glencoe Algebra 1, Student Edition, 9780079039897…
Algebra
ISBN:
9780079039897
Author:
Carter
Publisher:
McGraw Hill
Glencoe Algebra 1, Student Edition, 9780079039897…
Algebra
ISBN:
9780079039897
Author:
Carter
Publisher:
McGraw Hill