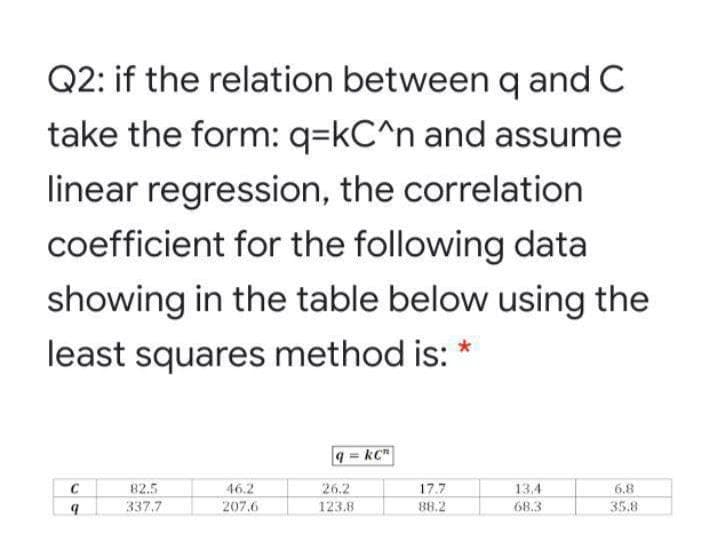
Q2: if the relation between q and C take the form: q=kC^n and assume linear regression, the correlation


Q: r multiple months. For this estimation, you can write down the error term of the econometric model…
A: The variables are : 1 Independent variable Rainfall 2 Dependent variable Number of car…
Q: Americans receive an average of 18 Christmas cards each year. Suppose the number of Christmas cards…
A:
Q: The accompanying data are the number of wins and the earned run averages (mean number of earned runs…
A: “Since you have posted a question with multiple sub-parts, we will solve the first three sub-parts…
Q: The following data represent the dividend yields (in percent) of a random sample of 28 publicly…
A: Given data is…
Q: Suppose that the following is to be tested: Ho: p= 0.72 and Ha: p *0.72. Calculate the observed…
A: It is given that x=68 and n=90.
Q: The Acme Company manufactures widgets. The distribution of widget weights is bell-shaped. The widget…
A: Given that The data is normally distributed with Mean (μ) = 35 ounces Standard deviation (σ) = 7…
Q: solving a problem where 100 different products (100 real variables) are produced using just two…
A: it is given that the In solving a problem where 100 different products (100 real variables) are…
Q: A research scientist wants to know how many times per hour a certain strand of bacteria reproduces.…
A:
Q: 1000 health practitioners in Zambia were surveyed during the COVID-19 outbreak, of these 380 of them…
A: We have given that, Sample size (n) = 1000 and favorable cases (X) = 380 Then, We will find margin…
Q: A student researcher found that 18 randomly selected rice farms had a mean harvest score of 86 and…
A: Given n1=18, sample mean x̄1=86, s1=6.25 n2=24, sample mean x̄2=80, s2=3.45
Q: 4.Calculation (1020'=20') Study the relationship between monthly household consumption expenditure y…
A: The question is about regression Given :
Q: Assume the population distribution has a mean of 100 and a standard deviation of 10. We test an…
A: The population mean is 100 and the standard deviation is 10.
Q: 3 A card is drawn from a full pack of 52 playing cards. If the card drawn is an Ace, King, Queen or…
A:
Q: 1. A team at a factory is monitoring the average number of defects in TV screens. Thirty-five TV…
A: Since you have asked multiple questions, we will solve the first question for you. If you want any…
Q: A survey of 35 museums asked to provide the performance measure used most often for intermal…
A: Solution: Given information: n= 35 Sample size k= 5 Categories
Q: A sample of 18 observations taken from a normally distributed population produced the following dat…
A: Solution given data, 28.1 27.1 25.2 25.5 31.2 23.1 26.2 24.1 28.4 37.1 23.9 28.9 27.6 25.5 27.3…
Q: You have measured the length of a table to be 205.0 cm, 205.8 cm, 205.4 cm, 204.6 cm, and 204.9 cm…
A: a) Mean length of the table and the standard deviation of the mean length of the table. Given,…
Q: 740 students applied for admission to G11 Senior High School at USTP. Of those applicants, 123 were…
A: Answer : - 740 student applied for admission to G11 senior high school at USTP. Of…
Q: The diameters of ball bearings are distributed normally. The mean diameter is 87 mm and the standard…
A:
Q: For numbers 13 to 15. Find the measures of position of the grouped data in Column A and B. Then…
A: Frequency distribution Qi=L+ f*(( i*N/4)−c.f)/h, where L is lower class boundary, f is frequency…
Q: Question 1 Why might central tendency be helpful for interpreting data? A. It can tell us the…
A: Mean is generally considered the best measure of central tendency and the most frequently used .
Q: Q2 (a) The surface roughness of ground product has a normal distribution with mean of 2.5 µm and…
A: Each hypothesis test has two errors, they are type 1 and type 2 error. Type 1 error is reject the…
Q: The regional manager of a franchise business is interested in understanding how income in a region…
A: The regression line has two coefficients, they are slope and intercept. Slope is the changing…
Q: The average amount of money spent for lunch per person in the college cafeteria is $5.82 and the…
A: GivenMean(μ)=5.82standard deviation(σ)=2.5sample size(n)=46
Q: The ages (in years) of a random sample of shoppers at a gaming store are shown. Determine the range,…
A:
Q: The number of credits being taken by a sample of 13 full-time college students are listed below.…
A: Given that Number of data values (n) = 13 The data values are 8 , 10 ,11 , 11 , 8 , 9 , 7 , 7 , 7…
Q: Directions: Given the range, class intervals, class interval size and first class interval,…
A: Range is the difference between the highest and lowest value for a set of values. For a large number…
Q: According to the records of an electric company serving the Boston area, the mean electric…
A: The mean and standard deviation are 1650 and 320, respectively.
Q: below Private nonprofit four-year colleges charge, on average, $27,987 per year in tuition and fees.…
A:
Q: QUESTION 3 In normally distributed random variables, any value above or below two standard…
A: Note: As per guidelines we are supposed to solve only one question at a time. please repost the…
Q: xplot indicates 4.80 4.75 4.77 D 4.47 5.19 5.18 5.82 4.75 5.11 4.79 4.73 4.52 Click the icon to view…
A:
Q: Current Attempt in Progress Find to 3 decimal places the value of t for the t distribution for the…
A:
Q: A researcher wants to compare the effect of several method on gold plating. For the first method,…
A: For method 1 Mean=1.5 S1=0.25 n1=7 For method 2 Mean=1.0 S2 =0.15 n2=5
Q: Need help with c,d and f
A:
Q: 3. Determining the Sample Size: The average cost of a gallon of unleaded gasoline in Greater…
A: 3)
Q: 3. Sports officer collected some information about the Body Mass Index (BMI) and the finishing…
A: 3) Given data indicates BMI and finishing positions of ten male adults in a marathon.
Q: Researchers at a reputable university and a reputable health organization claim that approximately…
A: The sample size n is 85 and p=0.75.
Q: Given a normal distribution with μ = 30 and o=6, find (a) the normal curve area to the right of x =…
A: According to our guidelines, we can answer only three sub-parts. So please repost the rest parts.
Q: According to the records of an electric company serving the Boston area, the mean electricity…
A: The mean and standard deviation are 1650 and 320, respectively.
Q: Formulate the indicated conclusion in nontechnical terms. Be sure to address the original claim. A…
A: 29) Option B is the correct one. Null hypothesis H0: p=1 against alternative Hypothesis Ha:p<1…
Q: A researcher wants to assess if there is a difference in the average life spans between men and…
A: Givenμ1=average life span of japanese womenμ2=average life span of japanese menFor…
Q: A newsgroup is interested in constructing a 95% confidence interval for the difference in the…
A:
Q: 6) Solve with the complete method. Assume Z has a standard normal distribution. Use Appendix Table…
A: Let Z be the random variable from standard normal distribution with mean = 0 and standard deviation…
Q: Thinking of the many variables tracked by hospitals and doctors' offices, confidence intervals could…
A: Let us consider the variable the average weight of males who admitted as patients in hospitals. A…
Q: et x be a continuous random variable that has a normal distribution with μ = 48 and robability that…
A: The mean and standard deviation are 48 and 8, respectively.
Q: c) What is the meaning of the standard deviation in relation to the data? (A 1) d) Describe how the…
A: The given data indicates the heights of students. Mean is the average of the data. It is the sum of…
Q: Find the area between.x = 18 and .x = 23 under a normal distribution curve with μ = 20 and o = 4.…
A: The mean and standard deviation are 20 and 4, respectively.
Q: According to the given data, how many possible research paper combinations can be written about…
A: here given , The students in an eighth-grade Social Studies class were assigned a research paper.…
Q: c) A researcher wishes to claim that the average final examination mark of Manufacturing Technology…
A:
Q: The goals scored per game by a soccer team represent the first quartile for all teams in a league.…
A: The goals per game by a soccer team represents the first quartile for all teams in a league.

Step by step
Solved in 2 steps

- Olympic Pole Vault The graph in Figure 7 indicates that in recent years the winning Olympic men’s pole vault height has fallen below the value predicted by the regression line in Example 2. This might have occurred because when the pole vault was a new event there was much room for improvement in vaulters’ performances, whereas now even the best training can produce only incremental advances. Let’s see whether concentrating on more recent results gives a better predictor of future records. (a) Use the data in Table 2 (page 176) to complete the table of winning pole vault heights shown in the margin. (Note that we are using x=0 to correspond to the year 1972, where this restricted data set begins.) (b) Find the regression line for the data in part ‚(a). (c) Plot the data and the regression line on the same axes. Does the regression line seem to provide a good model for the data? (d) What does the regression line predict as the winning pole vault height for the 2012 Olympics? Compare this predicted value to the actual 2012 winning height of 5.97 m, as described on page 177. Has this new regression line provided a better prediction than the line in Example 2?Suppose that the following import function for Turkey is estimated for Turkey between 1980-2015. In order to measure the impact of 2001 crisis the regression is estimated based on the whole and two subsamples and the following RSS are obtained. Time period: 1980-2000 , RSS1= 69 Time period: 2001-2015, RSS2 =35 Time period: 1980-2015 , RSS = 160 Carry out the Chow test whether the regressions for the two periods are different at 5% significance level.Suppose that the following import function for Turkey is estimated for Turkey between 1980-2015. In order to measure the impact of 2001 crisis the regression is estimated based on the whole and two subsamples and the following RSS are obtained. Time period: 1980-2000 , RSS1= 69 Time period: 2001-2015, RSS2 =35 Time period: 1980-2015 , RSS = 160 Carry out the Chow test whether the regressions for the two periods are different at 5% significance level.
- Suppose that the following import function for Turkey is estimated for Turkey between 1980-2015 In order to measure the impact of 2001 crisis the regression is estimated based on the whole and two subsamples and the following RSS are obtained. Time period: 1980-2000 , RSS1= 69 Time period: 2001-2015, RSS2 =35 Time period: 1980-2015 , RSS = 160 Carry out the Chow test whether the regressions for the two periods are different at 5% significance level.vel.The following table gives the data for the average temperature and the snow accumulation in several small towns for a single month. Determine the equation of the regression line, yˆ=b0+b1x�^=�0+�1�. Round the slope and y-intercept to the nearest thousandth. Then determine if the regression equation is appropriate for making predictions at the 0.050.05 level of significance. Critical Values of the Pearson Correlation Coefficient Average Temperatures and Snow Accumulations Average Temperature (℉℉) 3939 2525 1515 4242 4242 2424 3232 2020 3030 3737 Snow Accumulation (in.in.) 66 1515 2929 66 1414 2626 2323 1212 1616 77 Copy Data Regression equation: yˆ=�^= Is the equation appropriate? YesAn experiment was carried out to observe the relationship between the time (Y) necessary for a vendor to supply a showcase in a store with sodas, and the boxes of product supplied (X), the information recorded is as follows (image) From the data: a. Get the fitted simple linear regression model b. Construct a scatterplot and discuss the result c. perform the analysis of variance. Thanks
- The following table gives the data for the average temperature and the snow accumulation in several small towns for a single month. Determine the equation of the regression line, yˆ=b0+b1xy^=b0+b1x. Round the slope and y-intercept to the nearest thousandth. Then determine if the regression equation is appropriate for making predictions at the 0.01 level of significance. Critical Values of the Pearson Correlation Coefficient Average Temperatures and Snow Accumulations Average Temperature (℉℉) 45 31 16 35 35 22 26 23 25 39 Snow Accumulation (in.in.) 9 20 23 6 10 29 22 14 12 9 Question 1: Regression equation y=__________ Question 2: Is the equation appropriate? Yes or No?The following table gives the data for the average temperature and the snow accumulation in several small towns for a single month. Determine the equation of the regression line, yˆ=b0+b1xy^=b0+b1x. Round the slope and y-intercept to the nearest thousandth. Then determine if the regression equation is appropriate for making predictions at the 0.01 level of significance. Critical Values of the Pearson Correlation Coefficient Average Temperatures and Snow Accumulations Average Temperature (℉℉) 42 27 22 39 44 21 27 18 32 36 Snow Accumulation (in.in.) 6 11 22 8 12 27 27 20 12 6 Regression equation y=_______________ Is the equation appropriate?The following table gives the data for the average temperature and the snow accumulation in several small towns for a single month. Determine the equation of the regression line, yˆ=b0+b1x. Round the slope and y-intercept to the nearest thousandth. Then determine if the regression equation is appropriate for making predictions at the 0.01 level of significance. Critical Values of the Pearson Correlation Coefficient Average Temperatures and Snow Accumulations Average Temperature (℉) 42 27 22 39 44 21 27 18 32 36 Snow Accumulation (in.) 6 11 22 8 12 27 27 20 12 6
- Which of the following are correct statements for linear regression? 1. If the scatter plot of the residual and the predicted response of a linear regression model shows a relationship between the two, then the model is good. 2. Linear regression is not sensitive to outliers. 3. LASSO could be used for variable selection. 4. If the Pearson's correlation coefficient between feature X1 and response Y is small, then there is weak evidence of correlation between X1 and Y. 5. If one uses a large penalty in ridge regression, then the bias in the model is high. 6. If the training data size is increased, then the bian and variance of the model increase. 7. One can use a maximum likelihood estimator in the case of linear regression under the assumption that the errors are independent and identically distributed.randomly selected middle school students. Using this data, consider the equation of the regression line, yˆ=b0+b1x, for predicting the overall grade average for a middle school student based on the number of hours spent unsupervised each day. Keep in mind, the correlation coefficient may or may not be statistically significant for the data given. Remember, in practice, it would not be appropriate to use the regression line to make a prediction if the correlation coefficient is not statistically significant. Hours Unsupervised 1.5 2 3 3.5 4 4.5 5.5 Overall Grades 99 96 84 75 68 65 60 Table Step 1 of 6 : Find the estimated slope. Round your answer to three decimal places.randomly selected middle school students. Using this data, consider the equation of the regression line, yˆ=b0+b1x, for predicting the overall grade average for a middle school student based on the number of hours spent unsupervised each day. Keep in mind, the correlation coefficient may or may not be statistically significant for the data given. Remember, in practice, it would not be appropriate to use the regression line to make a prediction if the correlation coefficient is not statistically significant. Hours Unsupervised 1.5 2 3 3.5 4 4.5 5.5 Overall Grades 99 96 84 75 68 65 60 Table Find the estimated slope, y interscept and correlation coefficient Round your answers to three decimal places.
