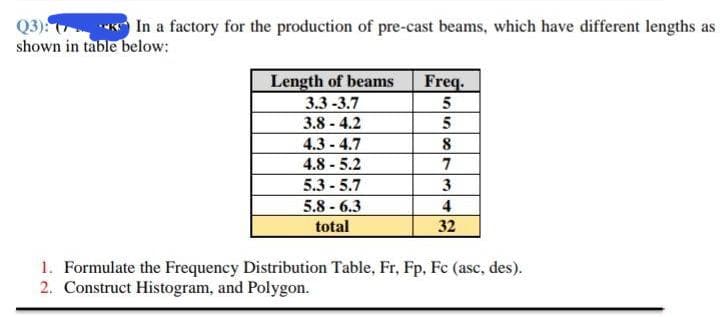
Q3): In a factory for the production of pre-cast beams, which have different lengths as shown in table below: Length of beams Freq. 3.3-3.7 3.8 -4.2 4.3-4.7 4.8 - 5.2 5 5.3 -5.7 5.8 - 6.3 4 total 32 1. Formulate the Frequency Distribution Table, Fr, Fp, Fc (asc, des). 2. Construct Histogram, and Polygon.


Q: (c) If the storeroom has 30 reams at the start of the day, how many should the manager expect to…
A: Given: X 0 1 2 3 4 5 P(X=x) 0.05 0.15 0.25 0.4 0.05 0.1
Q: A standard deck of cards contains 52 cards, with 13 cards of each suit. Four cards will be dealt off…
A: We have given the following statement about cards.
Q: What is the test statistic for this sample? (Report answer accurate to three decimal places.) test…
A: Given data number of success , x= 306 sample size, n =448 population proportion,p= 0.73
Q: In a big cooler in the kitchen there are the following drinks: 15 bottles of soda, 4 cans of soda, 9…
A: In a big cooler in the kitchen there are the following drinks: 15 bottles of soda, 4 cans of soda, 9…
Q: 8. Let S(t) be a positive stochastic process that satisfies the generalized geometric Brownian…
A: Given that, Let S(t) be a positive stochastic process that satisfies the generalized…
Q: Among freshmen at a certain university, scores on the Math SAT followed the normal curve, with an…
A: We have given that, Population mean (μ) = 550 and standard deviation (σ) = 100 Then, We will find…
Q: If three donations are made, what is the probability that at least 1 of them can be safely used in a…
A:
Q: A 95% confidence interval for the average household income in a town is constructed based on a…
A: Given: The 95% confidence interval of population mean is [ 64000 , 86000]
Q: Construct a 95% confidence interval for the population standard deviation at Bank A
A: We have given that the data of Bank A is, 6.3, 6.6, 6.7, 6.8, 7.1, 7.2, 7.5, 7.8, 7.8. The following…
Q: A data set lists earthquake depths. The summary statistics are n = 400, x = 6.82 km, s = 4.63 km.…
A:
Q: In a spelling contest, the mean mark of the 32 boys was 72 with the standard deviation of 8 while…
A: Given Data : For Sample 1 x̄1 = 72 s1 = 8 n1 = 32 For Sample 2 x̄2 = 75…
Q: What is the test statistic for this sample? (Report answer accurate to three decimal places.) test…
A: Given data number of success , x= 63 sample size, n =158 population proportion,p= 0.37…
Q: A Moving to another quest Question 27 Provide an appropriate response. In order for applicants to…
A: From the provided information, x y 3 61 4 68 4 75 5 82 3 73…
Q: True or false Boxplots can be used to see the distributions of all the variables in a data set.
A: Box plots is one of the many graphical representations used by statisticians to study the…
Q: THE CRITICAL VALUE FOR TWO TAILED TEST AT 5% LEVEL OF SIGNIFICANCE IS Your answer
A:
Q: Since the Fair Labor Standards Act was passed in 1938, the standard work week in the United States…
A: For the given statement Select the correct choice
Q: you compute a two-sample z statistic and it comes out to equal 1.6. What is the p-value if you are…
A:
Q: Q.2) A manager at the delivery company recorded the mean and median delivery cost, but unfortunately…
A: A manager recorded the mean delivery cost and median delivery cost on a paper but unfortunately lost…
Q: A school psychologist is interested in the efficiency of administration for a new intelligence test…
A: Given: A researcher is interested to test the efficiency of administration for a new intelligence…
Q: In a recent year, the total scores for a certain standardized test were normally distributed, with a…
A: Let X be the random variable from normal distribution with mean (μ) = 500 and standard deviation (σ)…
Q: Which of these statements does not contain a statistical mistake? O a. A strong correlation between…
A: Correlation ranges from -1 to 1.
Q: Determine the sample size to be considered for a research work that will involve a population size…
A: From the provided information, Since you have posted a question with multiple sub-parts, we will…
Q: A large group of people get together. Each one rolls a die 180 times, and counts the number of aces…
A: A large group of people get together. Each one rolls a die 180 times
Q: One hundred draws are made at random with replacement from a box with the following 4 tickets: 1, 2,…
A: The distribution of the selected tickets is to be interpreted, both for the population level and…
Q: Provide an appropriate response. Determine the probability distribution's missing value. The…
A: sum of all probability is equals to 1.
Q: 1.) State the null and alternative hypotheses. 2.) Determine the Test Statistic and p-value. 3.)…
A: Given: Sales persons Month before the seminar Month after the seminar 1 12 18 2 18 21 3 24…
Q: A teacher believes that the average score on a Statistics exam is 75. A sample is taken from 30…
A:
Q: 7) Please answers in the space provided. Arrange the labels for each scatterplot in order from…
A: Arrange the labels for each scatterplot in order from weakest correlation to strongest correlation
Q: According to Census data, in 1960 the population of the U.S amounted to 151.3 million persons, and…
A: In a study, the statistical significance difference explains the effect that is inferred to exist at…
Q: One of the theories behind the large polling errors in 2016 election was the "shy Trump voter".…
A: Option D response bias is the answer.
Q: Experience has shown that the diameter of a machined component is normally distributed, with an…
A: Let X be the random variable from normal distribution with mean (μ) = 165, standard deviation (σ) =…
Q: Compute the overall sample mean x b. Set up the ANOVA table for this problem including the test…
A:
Q: What is the expected value of a ticket?
A: here given, Supposed that 2000 tickets are sold for a raffle that has the following prizes: one $200…
Q: The frequency table below shows the compressive strength of concrete cubes results: Compressive…
A: Given frequency table is Compressive strength (Mpa) No. of cubes 41-50 6 51-60 10 61-70…
Q: Calculate the approximate proportion of house prices that fall between $1,000,000 and $2,000,00C…
A: The relative frequency histogram of house prices is given.
Q: t X1, X2,.., X1o be a random sample from a distribution that is N (01,02). st test of the simple…
A:
Q: 6. Calculate the value of p if the ratio of the probability of an event happening exactly r times in…
A:
Q: A large sample of children was followed over time. One investigator looked at all the children who…
A: Percentile: Percentile is the percentage of data values that lies below a particular data value.…
Q: WHAT IS TYPE 1 ERROR? * A. ACCEPT Ho IF Ho IS TRUE B. ACCEPT Ho IF Ho IS FALSE C. REJECT Ho IF Ho IS…
A: Type II error is accepting Ho when it is false.
Q: Which of the following statements is true when discussing a series of coin flips (assuming the coin…
A: Given that, a series of coins are flipped (assuming the coin is fair).
Q: A hypothesis test produces a p-value of 1.5%. Which of the following are DEFINITELY true? Check all…
A:
Q: ty notation? (Z2-3.87) x P(T2-3.87) 2 x P(ZS-3.87) PITS-3 87)
A: Given Samples of 50, test statistic of t = - 3.87
Q: Four scenarios of statistical studies are given below. Decide which study uses a sample statistic. O…
A:
Q: Please find the numerical value of the area under the normal curve given the following information:…
A: The objective is to find the numerical value of the area under the normal curve which doesn't lie…
Q: Consider the following time series of returns for ABC stock and the S&P500 Index over 5 years. For…
A: Please find the explanation below. Thank you
Q: Collect data from 15 of your classmates as shown below and answer the following problem. Show…
A: The objective is to validate the claim that if the average no. of siblings for each student at the…
Q: When a = .10, what is the rejection region that should be used to test Ho:o? = 0} %3D against Assume…
A: Solution-: Given: α=0.10, v1=df1=10, v2=df2=12 H0:σ12=σ22 Vs H1:σ12>σ22 (Right tailed or…
Q: The results of a recent study regarding smoking and three types of illness are shown in the…
A: The chi-square test of association is a non parametric test.
Q: he data were collected from a specific statistics class. The first row gives the variable nam Eye…
A: Given The first row gives the variable names and each additional row represents a student in the…
Q: Marketing campaign A is tested in one of six regions and marketing campaign B is tested in another…
A:

Step by step
Solved in 3 steps with 2 images

- Calculateaconfidenceinterval for the me-dian ofthe second population.Select your confidenc eleve land reportit with your answer.??The probability limit of the OLS estimator in the case of omitted variables is given by the following formula: Give an intuitive explanation for two conditions under which the bias will be small.A data with 18 points will be integrated as accurately as possible using a combination of Simpson's rules. It will require ____ applications of Simpson's 3/8th rule and _____ applications of Simpson's 1/3rd rule
- The director of a shipping company believes that there is a relationship between the cost of a customer’s shipment (£) and the weight (lb) of the package being shipped. For investigating this possible relationship, a random sample of nine customer shipments was selected and the weight (in lb) and the cost (rounded to the nearest £) for each shipment were recorded. The results obtained are shown in the table below (on the picture). required: a) ) The scatter diagram showing the relationship between the cost of acustomer’s shipment (£) and the weight (lb) of the package being shipped, is given below. Comment fully and clearly on this diagram. i) ii)For 5.20, can you provide PH Stat path for calculating this?According to the National Center for Health Statistics (2004), 22.4% of adults are smokers. A random sample of 300 adults is obtained. Subquestion: What would the minimum number of adults need to be in order to ensure the sampled values are independent of each other?
- In a café, the manager wishes to estimate p, the proportion of customers who will order sandwich for their lunch. Suppose 30 out of 300 customers will order sandwich for their lunch. Find the probability that more than 40 customers will order sandwich for their lunch by using a suitable approximationSuppose the number of typographical errors on a single page of your book has a Poissondistribution with parameter λ = 1/2. Calculate the probability that there is at least one error onthis pageConsider the following data about number of hours that a sample of 10 person from population spent on studyin after class per day 5 4 4 2 5 0 2 3 5 10 calculate z score for observation 0 and interpret. USE IQR method and comment if the observation 10 is an outlier. Use one decimal place
- Suppose that in the previous semester, the percentages of students in the five sections of ECO 204 were 20%, 21%, 19%, 15% and 25%. However, in the current semester, among a sample of 200 students, the student distribution among five sections is 51, 49, 30, 20 and 50. Can we conclude that there has been a statistically significant change in the student proportions?Find kurtosis by using ungroup data given in the picture using quartile deviation, make sure to arrange data before solving question.A small (but heavy) particle placed in a glass of water will follow a zigzag motion because the particle will bounce off of the water molecules it meets. This is called Brownian motion. A physicist simulates this on a computer, by varying the distance a particle can travel (called the mean free length), on average, before it collides with a water molecule and assigning the change in motion to be one of 8 directions, each with a similar probability. By running the simulated particle (with the same mean free length) many times she determines that it should take 15 seconds, on average, for the particle to fall to the bottom, with a standard deviation of 1.5 seconds. Next she lets a real particle fall through a glass of water and finds that it took 18 seconds. What does she conclude, and why?