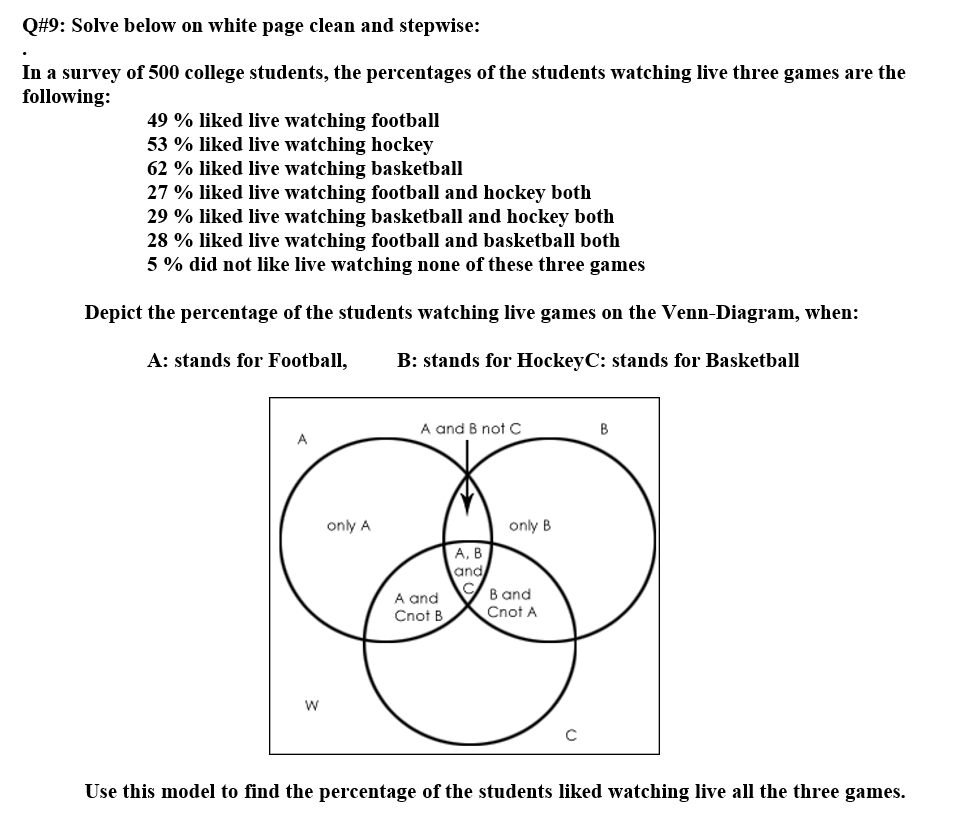
Q#9: Solve below on white page clean and stepwise: In a survey of 500 college students, the percentages of the students watching live three games are the following: 49 % liked live watching football 53 % liked live watching hockey 62 % liked live watching basketball 27 % liked live watching football and hockey both 29 % liked live watching basketball and hockey both 28 % liked live watching football and basketball both 5 % did not like live watching none of these three games Depict the percentage of the students watching live games on the Venn-Diagram, when:


Inverse Normal Distribution
The method used for finding the corresponding z-critical value in a normal distribution using the known probability is said to be an inverse normal distribution. The inverse normal distribution is a continuous probability distribution with a family of two parameters.
Mean, Median, Mode
It is a descriptive summary of a data set. It can be defined by using some of the measures. The central tendencies do not provide information regarding individual data from the dataset. However, they give a summary of the data set. The central tendency or measure of central tendency is a central or typical value for a probability distribution.
Z-Scores
A z-score is a unit of measurement used in statistics to describe the position of a raw score in terms of its distance from the mean, measured with reference to standard deviation from the mean. Z-scores are useful in statistics because they allow comparison between two scores that belong to different normal distributions.

Step by step
Solved in 2 steps with 2 images


