Question #1 For a just completed research project, the null hypothesis of the researchers was that the sample mean was equal to the population mean. Or in equation form: M= u. At the conclusion of the study, the following information was known: H = 32.4 M= 35.6 o = 6.3 n= 25 See page 5 of your notes if you cannot remember what these symbols mean. The formula to calculate Z for a population is: Z=M-p/(a/Vn). Note that the formula differs from a sample z which you have calculated in the past. You may calculate the numerator and denominator separately, then calculate the actual Z. a. 2.54 b. 1.56 с. 2.35 d. 1.6
Question #1 For a just completed research project, the null hypothesis of the researchers was that the sample mean was equal to the population mean. Or in equation form: M= u. At the conclusion of the study, the following information was known: H = 32.4 M= 35.6 o = 6.3 n= 25 See page 5 of your notes if you cannot remember what these symbols mean. The formula to calculate Z for a population is: Z=M-p/(a/Vn). Note that the formula differs from a sample z which you have calculated in the past. You may calculate the numerator and denominator separately, then calculate the actual Z. a. 2.54 b. 1.56 с. 2.35 d. 1.6

Algebra & Trigonometry with Analytic Geometry
13th Edition
ISBN:9781133382119
Author:Swokowski
Publisher:Swokowski
Chapter5: Inverse, Exponential, And Logarithmic Functions
Section5.6: Exponential And Logarithmic Equations
Problem 64E

Related questions
Topic Video
Question
Please answers the following questions. Please circle your answers. Thank you in advanced!
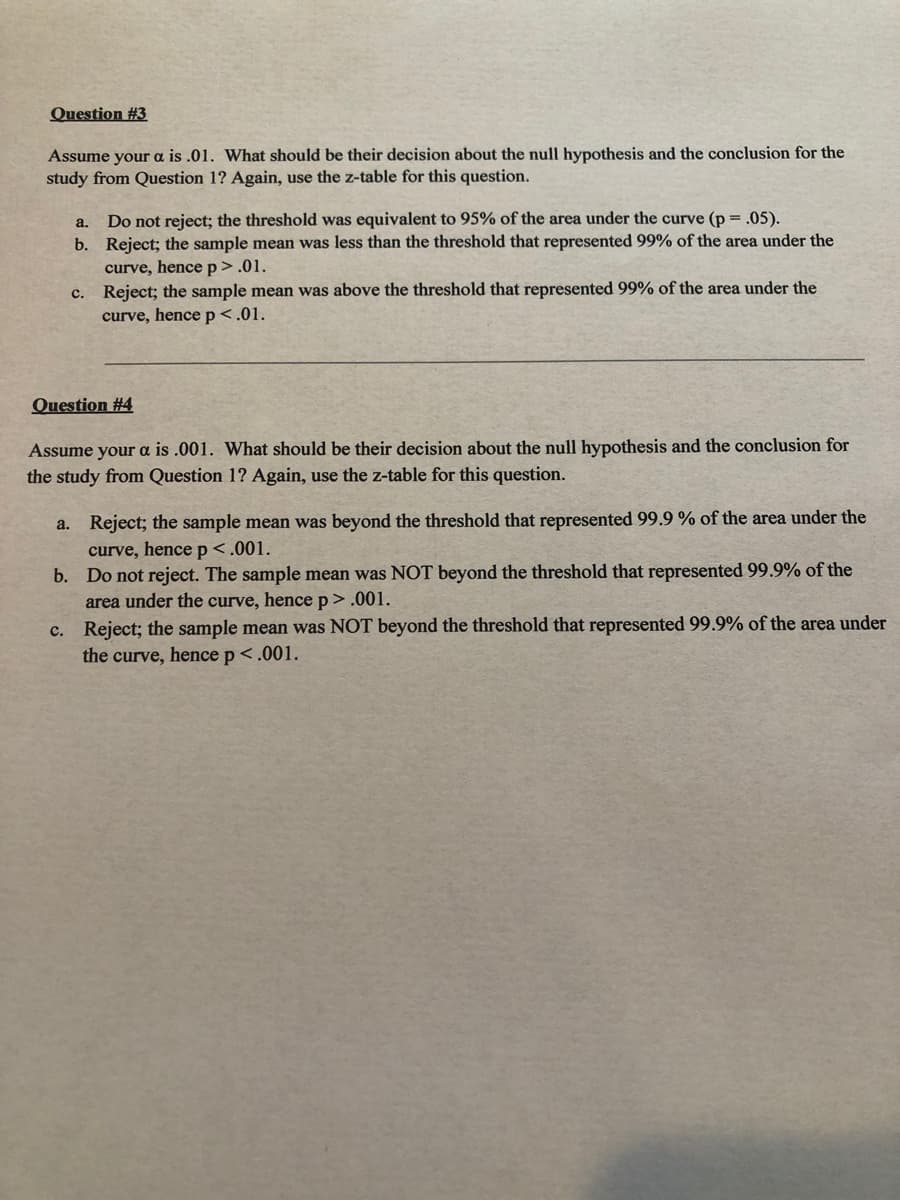
Transcribed Image Text:Question #3
Assume your a is .01. What should be their decision about the null hypothesis and the conclusion for the
study from Question 1? Again, use the z-table for this question.
Do not reject; the threshold was equivalent to 95% of the area under the curve (p = .05).
b. Reject; the sample mean was less than the threshold that represented 99% of the area under the
a.
curve, hencep>.01.
c. Reject; the sample mean was above the threshold that represented 99% of the area under the
curve, hence p<.01.
Question #4
Assume your a is .001. What should be their decision about the null hypothesis and the conclusion for
the study from Question 1? Again, use the z-table for this question.
a.
Reject; the sample mean was beyond the threshold that represented 99.9 % of the area under the
curve, hence p<.001.
b. Do not reject. The sample mean was NOT beyond the threshold that represented 99.9% of the
area under the curve, hencep>.001.
c. Reject; the sample mean was NOT beyond the threshold that represented 99.9% of the area under
the curve, hence p<.001.
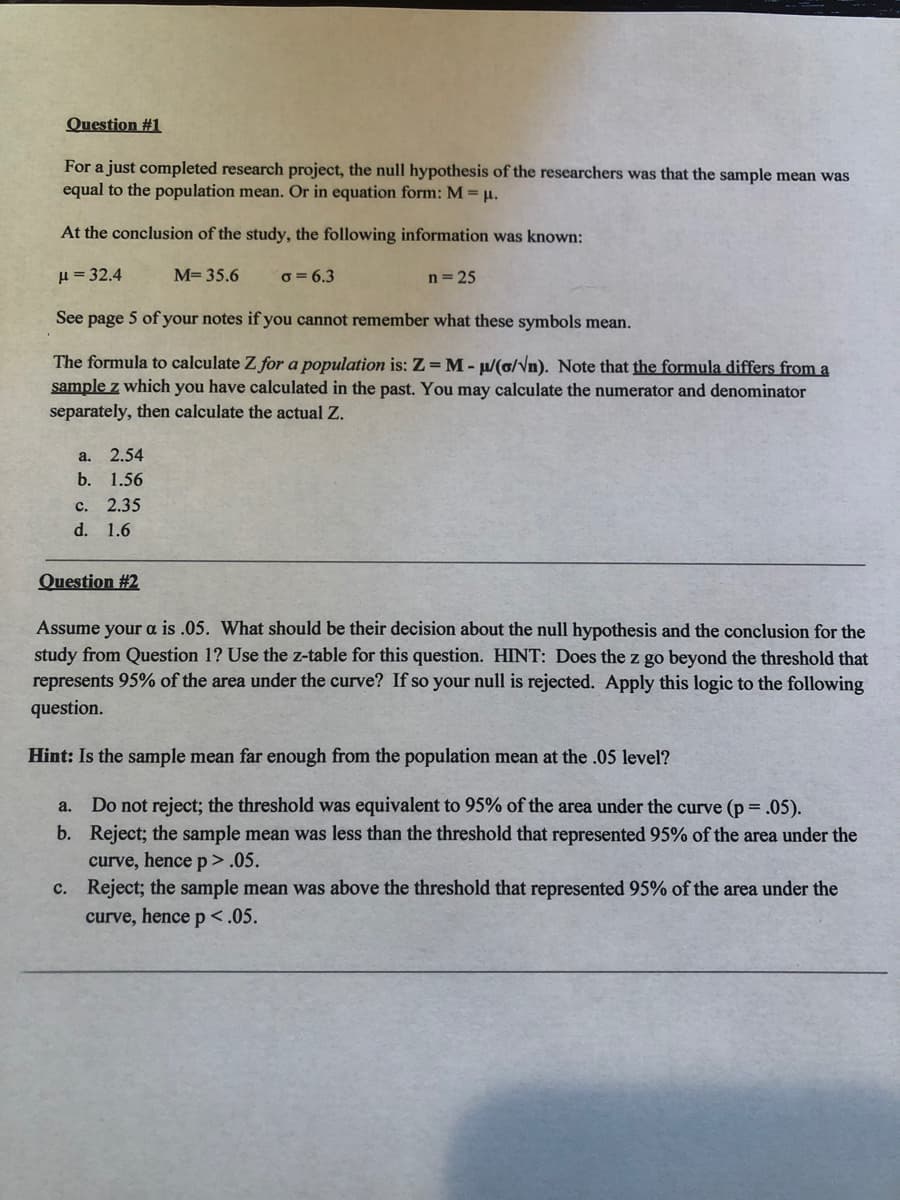
Transcribed Image Text:Question #1
For a just completed research project, the null hypothesis of the researchers was that the sample mean was
equal to the population mean. Or in equation form: M = u.
At the conclusion of the study, the following information was known:
H = 32.4
M= 35.6
o = 6.3
n = 25
See page 5 of your notes if you cannot remember what these symbols mean.
The formula to calculate Z for a population is: Z= M- µ/(o/Vn). Note that the formula differs from a
sample z which you have calculated in the past. You may calculate the numerator and denominator
separately, then calculate the actual Z.
а. 2.54
b. 1.56
с. 2.35
d. 1.6
Question #2
Assume your a is .05. What should be their decision about the null hypothesis and the conclusion for the
study from Question 1? Use the z-table for this question. HINT: Does the z go beyond the threshold that
represents 95% of the area under the curve? If so your null is rejected. Apply this logic to the following
question.
Hint: Is the sample mean far enough from the population mean at the .05 level?
a. Do not reject; the threshold was equivalent to 95% of the area under the curve (p = .05).
b. Reject; the sample mean was less than the threshold that represented 95% of the area under the
curve, hence p> .05.
c. Reject; the sample mean was above the threshold that represented 95% of the area under the
curve, hence p<.05.
Expert Solution
This question has been solved!
Explore an expertly crafted, step-by-step solution for a thorough understanding of key concepts.

This is a popular solution!

Trending now
This is a popular solution!

Step by step
Solved in 2 steps with 1 images

Knowledge Booster


Learn more about
Need a deep-dive on the concept behind this application? Look no further. Learn more about this topic, statistics and related others by exploring similar questions and additional content below.Recommended textbooks for you
Algebra & Trigonometry with Analytic Geometry
Algebra
ISBN:
9781133382119
Author:
Swokowski
Publisher:
Cengage

Algebra: Structure And Method, Book 1
Algebra
ISBN:
9780395977224
Author:
Richard G. Brown, Mary P. Dolciani, Robert H. Sorgenfrey, William L. Cole
Publisher:
McDougal Littell
Algebra & Trigonometry with Analytic Geometry
Algebra
ISBN:
9781133382119
Author:
Swokowski
Publisher:
Cengage
Algebra: Structure And Method, Book 1
Algebra
ISBN:
9780395977224
Author:
Richard G. Brown, Mary P. Dolciani, Robert H. Sorgenfrey, William L. Cole
Publisher:
McDougal Littell