QUESTION 1: Function Form regression Model Using the Comb Douglas production function for API generation, the empirical results are given as follows: Model X : Y = 12.4281-0.7608pl -24.6154pk-12.3621pf (15.8223) (3.2471) (24.1574) (4.5137) Adjusted R-square = 0.7999
Q: The methods of least squares regression finds the best line by minimizing? Sum of squared residuals?…
A: Solution Step 1. The method of least squares is use d to find the estimate of regression…
Q: An appropriate measure of association for wondering whether gender (male =1, female =2) has an…
A: We have to determine the measure of association between gender and happiness.
Q: In a survey, 26 people were asked how much they spent on their child's last birthday gift. The…
A: Given X-bar=39 Standard deviations=3 n=26
Q: The data below are from an independent-measures experiment comparing three different treatment…
A: Given Treatment 1 Treatment 2 Treatment 3 0 1 4 0 4 3 0 1 6 2 0 3
Q: 13. A researcher collected data from a sample that he chose and he wishes to understand the…
A: According to our policy we can answer only first three part for remaining please repost the…
Q: Larger or smaller P-value? Juan and Mary want to test the null hypothesis that the mean length of…
A: Given: μ=10Jaun's sample mean, x¯=8.4Mary's sample mean,y¯=7.3
Q: 9. The Mean of a binomial distribution is 20 and S.D. 4. Calculate n, p and
A:
Q: Choose which of the following is true when the optimal solution in a maximization problem in simplex…
A: "Since you have asked multiple questions, we will solve the first question for you. If you want any…
Q: For the given data set: X y -4 -3 -2 -1 9 4 1 0 0 1 1 4 2 9
A: Given the data X Y -4 9 -3 4 -2 1 -1 0 0 1 1 4 2 9
Q: Explain the difference between bias and unbiased data and suggest reasons for . Consider the…
A: Unbiased - Accurate Biased - not accurate We have to tell difference between Biased and unbiased…
Q: The data below are from an independent-measures experiment comparing three different treatment…
A: Solution-: We find F-ratio=?
Q: A multiple choice test consists of 10 questions. Each question has 5 choices of which one is the…
A: The number of multiple choice questions is 10.
Q: For the given data set: X 812 y 10 7 Part 1 of 6 2 15 11 5 | ! |; 6 13 19 2
A: Given : A dats set x y 8 10 12 7 2 15 11 6 5 13 19 2
Q: in a survey, 26 people were asked how much they spent on their child's last birthday gift. The…
A:
Q: For 30 recent Academy Award ceremonies, ages of Best Supporting Actors (x) and ages of Best…
A: Introduction: It is required to predict the age of Best Supporting Actress in 1982, when the age of…
Q: Suppose that the duration of a particular type of criminal trial is known to be normally distributed…
A:
Q: The data below are from an independent-measures experiment comparing three different treatment…
A: Given Information: Total no. of treatments=03No. of observations (n)=12
Q: If on an average, 6 ships out of 10 arrive safely, find the Mean and the S.D. of the number of ships…
A:
Q: Let X₁, X2, Xn and Y₁, Y2,..., Yn be independent random samples from two normal distributions…
A:
Q: PLEASE ANSWER Q2 D7 P75
A: Quantile is the measure that seperate the data into equal number of parts. Some of the quantile…
Q: The data below are from an independent-measures experiment comparing three different treatment…
A:
Q: Consider the binary communication channel shown in Fig. 4.9. Let X, Ybe random variables, where X is…
A:
Q: Give two examples of parameters and explain each in terms of point estimates and point estimators.
A: Given that Give two examples of parameters and explain each in terms of point estimates and point…
Q: The school registrar estimates that the dropout rate of senior high schools in Cavite is 75%. Last…
A: Given Information: Claim: Dropout rate of senior high schools in Cavite is 75% i.e., p=0.75 Sample…
Q: The normal rate of infection of a certain disease with the children is found to be 20%. In an…
A:
Q: Find the value of X using Normal Distribution, if P(-X <Z <+X) = 0.9756 1.55 O 0.77 O 1.78 O 3.15 O…
A: Given,P(-X<Z<X)=0.9756
Q: Illustration 32. Point out the fallacy, if any in the following statement : "The Mean of a binomial…
A:
Q: Suppose 6 of 15 students in a grade school develop influenza, whereas 20% of grade school class…
A: As per the Bartleby guildlines we have to solve first question and rest can be reposted.... Given…
Q: According to a study done by UCB students, the height for Martian adult males is normally…
A:
Q: 39. A sportsman's chance of shooting an animal at a distance r>a a² is He fires when r= 2a and if he…
A:
Q: How did you get 0,158 in question 1? Please show me your calculation.
A: How did you get 0,158 in question 1?
Q: Effects of drug and alcohol on the nervous system have been the subject of significant research. A…
A: The provided information is x¯=1.05s=0.5n=100α=0.05 The degrees of freedom is df=n-1=100-1=99…
Q: n insurance agent knows that 18% of deer-car collision claims are filed in November. Consider a…
A:
Q: Let X1, X2, . . . , Xn and Y1, Y2, . . . , Yn be independent random samples from two normal…
A:
Q: (b) (i) Create boxplots for these two data sets (either drawn by hand or as a printout from…
A: Box plot is the plot which used to understand the outlier and the skewness of the data set. This…
Q: Find the probability P (0<x<) for f(x) = x². cos x³ 0.235 O 0.304 O 0.908 O 0.413 O 0.678 O 0.112…
A:
Q: STATICS AND STENGITH OF MATERIALS Question: Load (kip) Elongation (in.) 0 0 A tension test was…
A:
Q: The weights of 100 female students aged 15 to 20 years have a mean of 120 pounds and a standard…
A: Given distribution is normal distribution. Let, X: Weight of female students In this example…
Q: 68% of statistics 95% of statistics 99.7% of statistics 4 Mean ▲ Mean 3 st dev 1 st. 1 st. 2 st. dev…
A: Considering μ and σ as the mean and standard deviation of no. of potholes in the 1-mile long…
Q: A soft-drink machine is regulated so that it discharges an average of 200 milliliters per cup. If…
A: The average amount of soft drink discharged(μ)=200 The standard deviation of the amount of soft…
Q: 13. If the standard quota of State X is 35.41, then which of the following apportionments to State X…
A:
Q: Scenario: A guidance counselor wanted to know if anxiety differs based on time (first day of class…
A:
Q: 26.(c) of three independent events the probability of first happening is the probability of second…
A:
Q: The data below are from an independent-measures experiment comparing three different treatment…
A: Given Number of treatment 3 Number of observation 12
Q: 1)dependent or independent 2) dependent or independent 3) dependent or independent
A: Given,P(A)=15 , P(B)=310 , P(A and B)=3100
Q: 9. The rejection region (or critical region) is the set of all values of the test statistic that…
A: We need to complete the given statements.
Q: For the data below, compute the Pearson correlation. X Y 3 4 2 5 1 9 6 2 Find coefficient of…
A:
Q: f the value of adult male cholesterol is a normal distribution with a mean of 198 and a standard…
A: The question is about normal dist. Given : Mean of cholesterol value of adult male ( μ ) = 198 Std.…
Q: Scenario: Researchers were interested in how social situations can influence stress-induced eating.…
A: The objective is to identify the most appropriate graph if every main effect and interaction is…
Q: Let X₁ X and Y follow the location model m X₁ = 0₁ + Zi, i = 1,...,n 02 + Zn+i i = 1,...,n Y₁ = ,m,…
A:
interpret the adjusted R-square for model Z
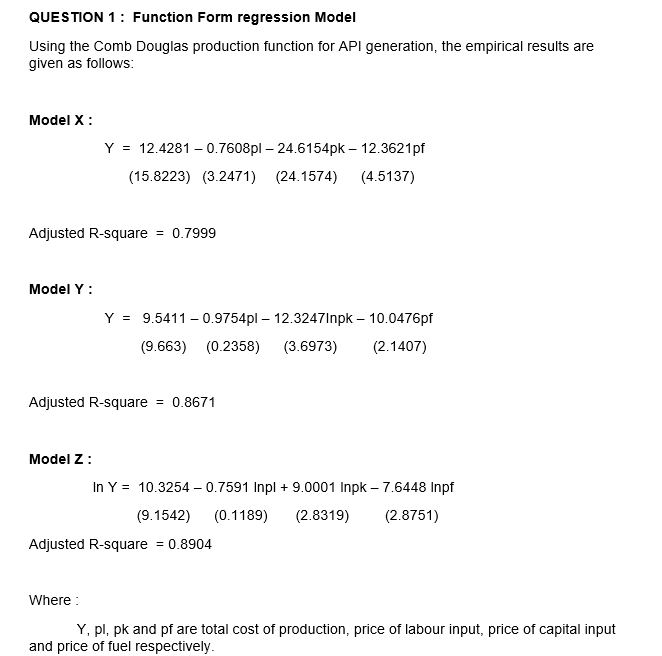
Step by step
Solved in 2 steps
- Olympic Pole Vault The graph in Figure 7 indicates that in recent years the winning Olympic men’s pole vault height has fallen below the value predicted by the regression line in Example 2. This might have occurred because when the pole vault was a new event there was much room for improvement in vaulters’ performances, whereas now even the best training can produce only incremental advances. Let’s see whether concentrating on more recent results gives a better predictor of future records. (a) Use the data in Table 2 (page 176) to complete the table of winning pole vault heights shown in the margin. (Note that we are using x=0 to correspond to the year 1972, where this restricted data set begins.) (b) Find the regression line for the data in part ‚(a). (c) Plot the data and the regression line on the same axes. Does the regression line seem to provide a good model for the data? (d) What does the regression line predict as the winning pole vault height for the 2012 Olympics? Compare this predicted value to the actual 2012 winning height of 5.97 m, as described on page 177. Has this new regression line provided a better prediction than the line in Example 2?The following fictitious table shows kryptonite price, in dollar per gram, t years after 2006. t= Years since 2006 0 1 2 3 4 5 6 7 8 9 10 K= Price 56 51 50 55 58 52 45 43 44 48 51 Make a quartic model of these data. Round the regression parameters to two decimal places.Zipfs Law The following table shows U.S cities by rank in terms of population and population in thousands. City Rank r Population N New York 1 8491 Chicago 3 2722 Philadelphia 5 1560 Dallas 9 1280 Austin 11 913 San Francisco 13 852 Columbus 15 836 A rule known as Zipfs law tells us that it is reasonable to approximate these data with a power function. a Use power regression to express the population as a function of the rank. b Plot the data along with the power function from part a. c Phoenix is the sixth largest city in the United States. Use your answer from part a to estimate population of Phoenix. Round your answer in thousands to the nearest whole number. Note: The actual population is 1537 thousand.
- 10.1 You estimated a regression with the following output. Source | SS df MS Number of obs = 213 -------------+---------------------------------- F(1, 211) = 4905.10 Model | 112084380 1 112084380 Prob > F = 0.0000 Residual | 4821474.15 211 22850.5884 R-squared = 0.9588 -------------+---------------------------------- Adj R-squared = 0.9586 Total | 116905854 212 551442.706 Root MSE = 151.16 ------------------------------------------------------------------------------ Y | Coef. Std. Err. t P>|t| [95% Conf. Interval] -------------+---------------------------------------------------------------- X | 25.44706 .3633405 70.04 0.000 24.73082 26.16331 _cons | 68.53346 32.19625 2.13 0.034 5.065942 132.001…Refer to the following computer output from estimating the parameters of the nonlinear model Y = aRbScTd The computer output from the regression analysis is: DEPENDENT VARIABLE: LNY R-SQUARE F-RATIO P-VALUE ON F OBSERVATIONS: 32 0.7766 32.44 0.0001 VARIABLE PARAMETER ESTIMATE STANDARD ERROR T-RATIO P-VALUE INTERCEPT -0.6931 0.32 -2.17 0.0390 LNR 4.66 1.36 3.43 0.0019 LNS -0.44 0.24 -1.83 0.0774 LNT 8.28 4.60 1.80 0.0826 Based on the information in the table, which of the parameter estimates are statistically significant at the 90% level of confidence?Refer to the following computer output from estimating the parameters of the nonlinear model Y = aRbScTd The computer output from the regression analysis is: DEPENDENT VARIABLE: LNY R-SQUARE F-RATIO P-VALUE ON F OBSERVATIONS: 32 0.7766 32.44 0.0001 VARIABLE PARAMETER ESTIMATE STANDARD ERROR T-RATIO P-VALUE INTERCEPT -0.6931 0.32 -2.17 0.0390 LNR 4.66 1.36 3.43 0.0019 LNS -0.44 0.24 -1.83 0.0774 LNT 8.28 4.60 1.80 0.0826 Based on the information in the table, if R = 1, S = 2, and T = 3, what value do you expect Y will have?
- Refer to the following computer output from estimating the parameters of the nonlinear model Y = aRbScTd The computer output from the regression analysis is: DEPENDENT VARIABLE: LNY R-SQUARE F-RATIO P-VALUE ON F OBSERVATIONS: 32 0.7766 32.44 0.0001 VARIABLE PARAMETER ESTIMATE STANDARD ERROR T-RATIO P-VALUE INTERCEPT -0.6931 0.32 -2.17 0.0390 LNR 4.66 1.36 3.43 0.0019 LNS -0.44 0.24 -1.83 0.0774 LNT 8.28 4.60 1.80 0.0826 Based on the information in the table, if S increases by 8% (all other things constant), Y will MultipleAlthough the Excel regression output, shown in Figure 12.21 for Demonstration Problem 12.1, is somewhat different from the Minitab output, the same essential regression features are present. The regression equation is found under Coefficients at the bottom of ANOVA. The slope or coefficient of x is 2.2315 and the y-intercept is 30.9125. The standard error of the estimate for the hospital problem is given as the fourth statistic under Regression Statistics at the top of the output, Standard Error = 15.6491. The r2 value is given as 0.886 on the second line. The t test for the slope is found under t Stat near the bottom of the ANOVA section on the “Number of Beds” (x variable) row, t = 8.83. Adjacent to the t Stat is the p-value, which is the probability of the t statistic occurring by chance if the null hypothesis is true. For this slope, the probability shown is 0.000005. The ANOVA table is in the middle of the output with the F value having the same probability as the t statistic,…Just parts d,e anf f of question 1 d) We conduct a simple regression of size on hhinc, now using robust standard errors. The regression output is reported in Table 2. Why are the estimated coefficients in Table 2 equal to the estimated coefficients in Table 1? Do the conclusions on the statistical significance at 5% of the coefficient of hhinc change between Tables 1 and 2? e) Now, using both the critical value and the p-value, test whether the coefficient of hhinc is statistically significant at 1%, by using the results in Table 1. Repeat the test by using the results in Table 2. Compare the results based on Table 1 with the results based on Table 2. Consider the results in Table 2. Compute the 99% confidence interval for hhinc. f) Consider the results in Table 2.How would you decide whether 0 is contained in the 99% confidence interval for the coefficient of hhinc, without actually computing the confidence interval?
- ch 11. 4 Oxnard Petro, Ltd., has three interdisciplinary project development teams that function on an ongoing basis. Team members rotate from time to time. Every 4 months (three times a year) each department head rates the performance of each project team (using a 0 to 100 scale, where 100 is the best rating). Are the main effects significant? Is there an interaction?Consider the following regression model: Dependent Variable: MU Sample: 134 Variable b BETA t-Statistic P-value Constant 7.292206 6.666348 0.0000 COLLEGE -0.115133 -0.23 -4.437697 0.0000 GROWTH 0.018898 0.01 1.718810 0.0880 SENIORS -0.022380 -0.24 -0.731017 0.4661 WAGE -0.0000294 -0.001 -0.874836 0.3833 R-squared 0.192456 Mean dependent var 3.852239 Adjusted R-squared 0.167416 S.D. dependent var 1.928368 Where MU = metropolitan area unemployment rate, COLLEGE = percentage of the metropolitan area population with a college degree, GROWTH = growth rate of the metropolitan area population, SENIORS = percentage of the metropolitan area population that is elderly, and WAGE = average metropolitan area wage Which two variables have the least impact on MU?Question 2: The estimated regression equation for a model involving two independent variables and 65 observations is: yhat = 55.17+1.1X1 -0.153X2 Other statistics produced for analysis include: SSR = 12370.8, SST = 35963.0, Sb1 = 0.33, Sb2 = 0.20.a. Interpret b1 and b2 in this estimated regression equation b. Predict y when X1 = 65 and X2 = 70. c. Compute R-square and Adjusted R-Square. d. Comment on the goodness of fit of the model. e. Compute MSR and MSE. f. Compute F and use it to test whether the overall model is significant using a p-value (α = 0.05). g. Perform a t test using the critical value approach for the significance of β1.Use a level of significance of 0.05. h. Perform a t test using the critical value approach for the significance of β2.Use a level of significance of 0.05.