Question 1.3. Plot a graph showing the average percent survival of each midge species (all three species on one graph) against time in oxygen-free water. Label the axes and provide a clear legend.


Q: Diet and Thyroid Iodine is an important micronutrient involved in thyroxine production. Without…
A: iodine is an element belonging to the halogen class . they are very vital for the body especially…
Q: Allbof these answers asap
A: Specimen It is a small quantity of a substance or object that is used for analysis and diagnosis. It…
Q: The Theory of Evolution
A: Evolution of the study of origin of earth, origin of life on earth and relationship between…
Q: The reasons why it can be hard to tell different species apart.
A: Evolution is defined by changes in the outward appearance or behaviour of members of a population.…
Q: These Three questions are also in relation to the graph.
A: The given graph is of rate of immigration and extinction in two islands A and B. Using the graph,…
Q: Please answer all questions as they are all related to the diagram,a like is guaranteed.
A: Crossing over occurs during prophase 1 of meiosis 1.
Q: • Organisms A, B, and C are all in the same family. Organisms B and C are in the same genus. Given…
A: Answer: There is a given taxonomic chart which tells us about the placements of organims in the…
Q: An Experiment on the Pulse-chase
A: Introduction: The pulse-chase analysis is a powerful technique to study the synthesis, processing,…
Q: A law professor wanted to determine if the amount of time students spend studying and preparing for…
A: Data analysis is an integral part of any scientific method. Until and unless the collected data is…
Q: Identify the most accurate statement: a. Sexual reproduction is often costly due to the need to…
A: Sexual reproduction is the type of reproductive process in which there is a requirement of the male…
Q: Testing the question Examine the following questions and decide which of them you think can be…
A: Answer - Yes, COVID-19 is caused by an RNA virus ( SARS-CoV-2) virus. It is transmitted through…
Q: Please answer only A, B, C. I will repost this question for the rest. Include a brief explanation…
A: Plesiomorphy is the presence of a primitive or ancestral character or plesiomorphic character. The…
Q: In the following, assume that the goal numbers collected come from a simple random sample of the…
A: Unknown Standard Deviation Means in Two Population --- For two distinct populations following…
Q: in response to this question, could you explain why in Step 3, R became 0.500 and why in Step 4,…
A: Michaelis menten constant, Km is the substrate concentration required to produce half maximum…
Q: Can you explain specifically what's happening in this graph
A: Graph represents a wide data specifically. It is easy way to understand wide data specifically. In…
Q: The pesticide DDT was widely used in the 1940s as a method of insect control. In the late 1950s the…
A: DDT resistant mosquitoes exist at low frequency in the global mosquito population and, when a local…
Q: Why CNG is coming in use these days rather than petrol and diesel. Give scientific reason for it.
A: Soon after the invention of motor vehicles, it opened ways for faster transport and commutation.…
Q: What describes relationships under certain conditions and give an example of it
A: A balanced relationship is one when there are mutual benefits to both the partners who are in…
Q: For this question, Order the terms according to scale from smallest to largest. Label the smallest…
A: The living world is in close association with the non-living components on the earth. The different…
Q: A reduced or incompletely developed structure in an organism that has no (or reduced) function (hint…
A: Evolution is a continuous transition of living forms, beginning with the basic forms of the past and…
Q: Ftracheary elements.
A: Answer: The xylem tissue moves water and nutrients to various parts of the plant such as shoots and…
Q: Using the data from the Broth Data table in step 1, determine the cardinal temperatures for each of…
A: Depending on the microbial survival in the specific temperature, microbes classified in the four…
Q: State the principle of the Handy Weinberg equilibrium and its assumption
A: Population genetics is basically the subfield of genetics that deals with the genetic difference…
Q: action than those of the new ones. Do you agree to this observation? Why and Why not?
A: Properties of muriatic acid Hydrochloric acid is known as muriatic acid, aqueous solution of…
Q: concerning possible evolutionary relationships to other phyla. Cycliophora & Gnathostomulida
A: These belongs to platyzoan phylum, and is based on single genus symbion. They are different from all…
Q: constant due to the metabolic costs of DDT utilization b) Natural selection favors DDT-resistant…
A: DDT is a deadly nerve poison when sprayed on a natural insect. DDT is no longer successful since…
Q: Emergent complexity, and hence biological evolution, arises due to a combination of many factors:…
A: entropy can be a direct measure of complexity, where the smaller value of entropy indicates lower…
Q: Suppose Inverness was considering offering a special add-on to its standard Dental insurance. For an…
A: Teeth whitening is one of the foremost prevalent cosmetic dentistry procedures since it could be a…
Q: There are around 40 species of sea stars that are affected by sea star wasting disease. Scientists…
A: variable:- variable is anything that can change or be changed. In a scientific research two variable…
Q: What is the diffrence between ultimate and proximate explanation and provide a topic with questions…
A: *ultimate explanations concerns on the fitness of a trait and whether it is selected or not…
Q: The amount of a drug injected into a guinea pig.
A: Answer: GUINEA PIG = These are the species of rodent which are also called domestic cavy and these…
Q: Why some animals and plants are kept in outside of their natural habitat .
A: What is a natural habitat and importance of natural habitat -A natural or ecological or…
Q: DNA and RNA are information-rich molecules. Explain thesignificance and implications of this…
A: Introduction: Nucleic acids are classified into two types: deoxyribonucleic acid and ribonucleic…
Q: Mindoro Black Rat (Rattus mindorensis) Explain the following taxon of this animal: Species -…
A: Taxon It refers to the unit used in the classification of on organism. Taxa are ordered in a…
Q: How and why living things over time have changed and why some of them have become extinct?
A: Introduction The disappearance of a type of organism or a collection of organisms, usually a…
Q: Question 1. (a) Name the following (i) The layer of the eyebal that provide nourishment to the eye.…
A: The ozone layer is composed of ozone gas formed by three oxygen atoms and it is found in the…
Q: Any similarity and difference of the following in any concept of life, may it be life strategies…
A: Mammals originate from the Latin word mamma which means breasts. This means mammals are a group of…
Q: Question 3 Which scientist is responsible for observing the first unicellular organism by looking at…
A: Biome is the largest ecosystem. Biome consists of aquatic and terrestrial ecosystems. The cell is…
Q: The pesticide DDT was widely used in the 1940s as a method of insect control. In the late 1950s the…
A: DDT resistant mosquitoes DDT is a pesticide that is used to control the insects. The mosquitoes…
Q: Both question correlate with each other
A: Single-nucleotide polymorphisms (SNPs) are single- nucleotide differences between two DNA molecules.…
Q: Question 8 In a metapopulation, a(n) is an area that can support a distinct subpopulation? O patch…
A:
Q: We can observe a progressive increase in efficiency of the digestive systems from Platyhelminthes to…
A: Since you have asked multiple question, we will solve the first question for you. If you want any…
Q: Debunking the Myth of Spontaneous Generation
A: Until seventeenth century people believed in abiogenesis or spontaneous generation of living…
Q: please answer all subquestions as they are all related to the diagram,a like is guaranteed.
A: Null hypothesis - expected ratio for dihybrid cross is 9:3:3:1.
Q: Select one of the four forces of evoultion. Provide a basic defintion of your selected force and…
A: Answer given below
Q: Frequency dependent selection..
A: Frequency-dependent selection is when the fitness of the trait is affected by the frequency of the…
Q: Effectiveness and significance of cosmopolitan distribution.
A: In biology an organism is said to be cosmopolitan (or cosmopolite) if it can be found almost…
Q: The pesticide DDT was widely used in the 1940s as a method of insect control. In the late 1950s the…
A: BASIC INFORMATION EVOLUTION The theory of evolution was first given by the Jean Baptist de Lamark.…
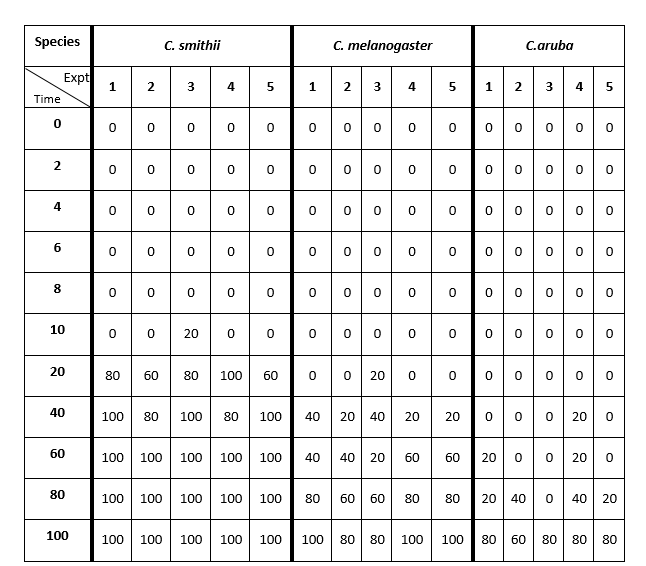
The effect of time (hours) on the mortality (%) of three species of Chironomus larvae exposed to oxygen-free water at a temperature of 20 °C. The table shows the results of five separate experiments conducted on each species of midge.(Species are fictitious)
Question 1.3. Plot a graph showing the average percent survival of each midge species (all three species on one graph) against time in oxygen-free water. Label the axes and provide a clear legend.

Step by step
Solved in 2 steps with 3 images

- State three examples of human activities that could endanger Botana curus. State three reasons why it might be important to preserve Botana curus. State two arguments people might make for NOT preserving Botananeed answer of 6,7,8. Do explain plzWhich of the following statements about Bacillus thuringiensis (Bt) corn are correct? Select all that apply. Question 19 options: Bt corn is only used for animal feed in the United States Bt corn has an inserted bacterial gene in its genome. Bt corn has increased nutritional value and a longer shelf life compared to corn that has not been genetically modified. Bt corn is approved for human consumption.
- please answer the advantage and disadvantage of these organismsCCK targets these organs. 1. 4 and 11 2. 3, 4 and 11 3. 4, 5 and 11 4. 3, 4, 5 and 11 5. 5 and 11Please use the image attached This is For Meal Worm Data: • During 2 weeks(14 days) in 6 Celsius temperature from 10 meal worm none shedded and none died • During 2 weeks(14 days) in 26 Celsius temperature 2 meal worms out of 10 shedded and 1 died having only 9 alive • During 4 weeks(28 days) in 6 Celsius temperature from 10 meal worms none shedded and none died they are just slow • During 4 weeks(28 days) in 26 Celsius temperature 2 meal worms out of 10 shedded and 1 died having only 9 alive also there was 1 pupae and they got slow because before they were fast Please please Site your sources for the information you found and Avoid saying: GROW, PROVE, IN THIS EXPERIMENT Common problems with poorly written lab reports. •Use the abstract to introduce the report instead of to summarize. •Refer to the specimen by common name instead of by scientific name. •Refer to errors that may have occurred without discussing the evidence that those errors actually did occur Can you…
- Please use the image attached This is For Meal Worm Data: • During 2 weeks(14 days) in 6 Celsius temperature from 10 meal worm none shedded and none died • During 2 weeks(14 days) in 26 Celsius temperature 2 meal worms out of 10 shedded and 1 died having only 9 alive • During 4 weeks(28 days) in 6 Celsius temperature from 10 meal worms none shedded and none died they are just slow • During 4 weeks(28 days) in 26 Celsius temperature 2 meal worms out of 10 shedded and 1 died having only 9 alive also there was 1 pupae and they got slow because before they were fast Please please Site your sources for the information you found and Avoid saying: GROW, PROVE, IN THIS EXPERIMENT Common problems with poorly written lab reports. • Use the abstract to introduce the report instead of to summarize. • Refer to the specimen by common name instead of by scientific name. • Refer to errors that may have occurred without discussing the evidence that those errors actually did occur Can you…Based on the text for mosquitoes eating: 1. Identify abiotic factors that support the survival and reproduction of the mosquitoes. 2. Identify biotic factors that support the survival and reproduction of the mosquitoes. 3. Predict what factors in the environment can be altered to decrease the survival and reproduction of the mosquities. PLEASE ANSWER BASED ON THE TEXT ONLY1.Discuss how developing organism are adapted to the ecological niches in which they developed. Kindly give specific example to support your answer. 2.Distinguish genotype from phenotype. Kindly give specific example. Note: answer number 1 and 2. Thank you
- please answer all questions Describe the general effects of gyromitrin/MMH poisoning and list the main genera containing gyromitrin/MMH. Describe orellanine poisoning and list the genus responsible for this type of poisoning. Describe some of the general effects of muscarine poisoning and the fungi responsible. Describe some of the general effects of ibotenic acid/muscimol poisoning and list the two main species responsiblefor this type of poisoning. Describe the effects of coprine poisoning and relate this to alcohol consumption. Describe the effects of psilocybin poisoning. Describe the effects of poisoning with gastrointestinal irritants.which of the following is not suffix of GATTACA? 1 CA 2 TTACA 3 GATT 4 AI need help with the following questions regarding SYLPHILLIS. Please make sure to asnwer all the things asked in each question. Totasl questions asked are FIVE. A,B, and C from question 1 and A and B from question 2. Please add the life cycle diagram in the question requesting the 1 C. Image can be from online source but to make sure to add the source. If any information is missing the the answer, i will it incomplete. thank you 1) Transmission:a) Mode: contact, vehicle, fecal-oral, vector, specifics with pictures;b) Reservoirs: humans, animals, water, food, etc….pictures!!c) Life cycle diagram 2. Control/Preventiona) Reservoir control: mosquito or rodent control, condoms, education, etc.b) Vaccine: when licensed, type (living attenuated, etc), schedule or timing (boosters? etc.) If none, current research.