Please use the image attached This is For Meal Worm Data: • During 2 weeks(14 days) in 6 Celsius temperature from 10 meal worm none shedded and none died • During 2 weeks(14 days) in 26 Celsius temperature 2 meal worms out of 10 shedded and 1 died having only 9 alive • During 4 weeks(28 days) in 6 Celsius temperature from 10 meal worms none shedded and none died they are just slow • During 4 weeks(28 days) in 26 Celsius temperature 2 meal worms out of 10 shedded and 1 died having only 9 alive also there was 1 pupae and they got slow because before they were fast Please please Site your sources for the information you found and Avoid saying: GROW, PROVE, IN THIS EXPERIMENT Common problems with poorly written lab reports. • Use the abstract to introduce the report instead of to summarize. • Refer to the specimen by common name instead of by scientific name. • Refer to errors that may have occurred without discussing the evidence that those errors actually did occur Can you please please answer I really need it please at least try to answer it's very important please thank you I would really appreciate it if you could please try to answer please answer super fast
Please use the image attached This is For Meal Worm Data: • During 2 weeks(14 days) in 6 Celsius temperature from 10 meal worm none shedded and none died • During 2 weeks(14 days) in 26 Celsius temperature 2 meal worms out of 10 shedded and 1 died having only 9 alive • During 4 weeks(28 days) in 6 Celsius temperature from 10 meal worms none shedded and none died they are just slow • During 4 weeks(28 days) in 26 Celsius temperature 2 meal worms out of 10 shedded and 1 died having only 9 alive also there was 1 pupae and they got slow because before they were fast Please please Site your sources for the information you found and Avoid saying: GROW, PROVE, IN THIS EXPERIMENT Common problems with poorly written lab reports. • Use the abstract to introduce the report instead of to summarize. • Refer to the specimen by common name instead of by scientific name. • Refer to errors that may have occurred without discussing the evidence that those errors actually did occur Can you please please answer I really need it please at least try to answer it's very important please thank you I would really appreciate it if you could please try to answer please answer super fast

Biomedical Instrumentation Systems
1st Edition
ISBN:9781133478294
Author:Chatterjee
Publisher:Chatterjee
Chapter5: Biomedical Electronics: Digital
Section: Chapter Questions
Problem 1RT

Related questions
Question
Please use the image attached This is For Meal Worm
Data:
• During 2 weeks(14 days) in 6 Celsius temperature from 10 meal worm none shedded and none died
• During 2 weeks(14 days) in 26 Celsius temperature 2 meal worms out of 10 shedded and 1 died having only 9 alive
• During 4 weeks(28 days) in 6 Celsius temperature from 10 meal worms none shedded and none died they are just slow
• During 4 weeks(28 days) in 26 Celsius temperature 2 meal worms out of 10 shedded and 1 died having only 9 alive also there was 1 pupae and they got slow because before they were fast
Please please Site your sources for the information you found and Avoid saying: GROW, PROVE, IN THIS EXPERIMENT
Common problems with poorly written lab reports.
• Use the abstract to introduce the report instead of to summarize.
• Refer to the specimen by common name instead of by scientific name.
• Refer to errors that may have occurred without discussing the evidence that those errors actually did occur
Can you please please answer I really need it please at least try to answer it's very important please thank you I would really appreciate it if you could please try to answer please answer super fast
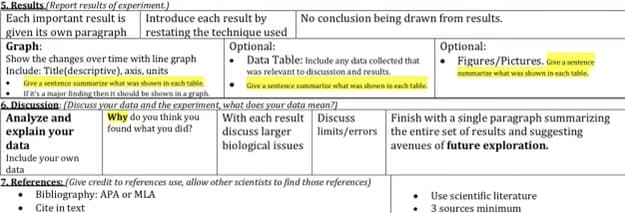
Transcribed Image Text:5. Results/Report results of experiment.)
Each important result is
given its own paragraph
Graph:
Analyze and
explain your
data
Introduce each result by
restating the technique used
Optional:
Show the changes over time with line graph
Include: Title(descriptive), axis, units
Give a sentence summarize what was shown in each table
If it's a major finding then it should be shown in a graph
6. Discussion: (Discuss your data and the experiment, what does your data mean?)
With each result
discuss larger
biological issues
Include your own
data
No conclusion being drawn from results.
Optional:
• Figures/Pictures. Give a sentence
summarize what was shown in each table.
Why do you think you
found what you did?
• Data Table: Include any data collected that
was relevant to discussion and results.
• Give a sentence summarize what was shown in each table
Discuss
limits/errors
7. References: (Give credit to references use, allow other scientists to find those references)
APA or MLA
Bibliography:
Cite in text
Finish with a single paragraph summarizing
the entire set of results and suggesting
avenues of future exploration.
Use scientific literature
3 sources minimum
Expert Solution
This question has been solved!
Explore an expertly crafted, step-by-step solution for a thorough understanding of key concepts.

This is a popular solution!

Trending now
This is a popular solution!

Step by step
Solved in 7 steps

Recommended textbooks for you

Comprehensive Medical Assisting: Administrative a…
Nursing
ISBN:
9781305964792
Author:
Wilburta Q. Lindh, Carol D. Tamparo, Barbara M. Dahl, Julie Morris, Cindy Correa
Publisher:
Cengage Learning

Principles Of Radiographic Imaging: An Art And A …
Health & Nutrition
ISBN:
9781337711067
Author:
Richard R. Carlton, Arlene M. Adler, Vesna Balac
Publisher:
Cengage Learning
Comprehensive Medical Assisting: Administrative a…
Nursing
ISBN:
9781305964792
Author:
Wilburta Q. Lindh, Carol D. Tamparo, Barbara M. Dahl, Julie Morris, Cindy Correa
Publisher:
Cengage Learning
Principles Of Radiographic Imaging: An Art And A …
Health & Nutrition
ISBN:
9781337711067
Author:
Richard R. Carlton, Arlene M. Adler, Vesna Balac
Publisher:
Cengage Learning
Case Studies In Health Information Management
Biology
ISBN:
9781337676908
Author:
SCHNERING
Publisher:
Cengage