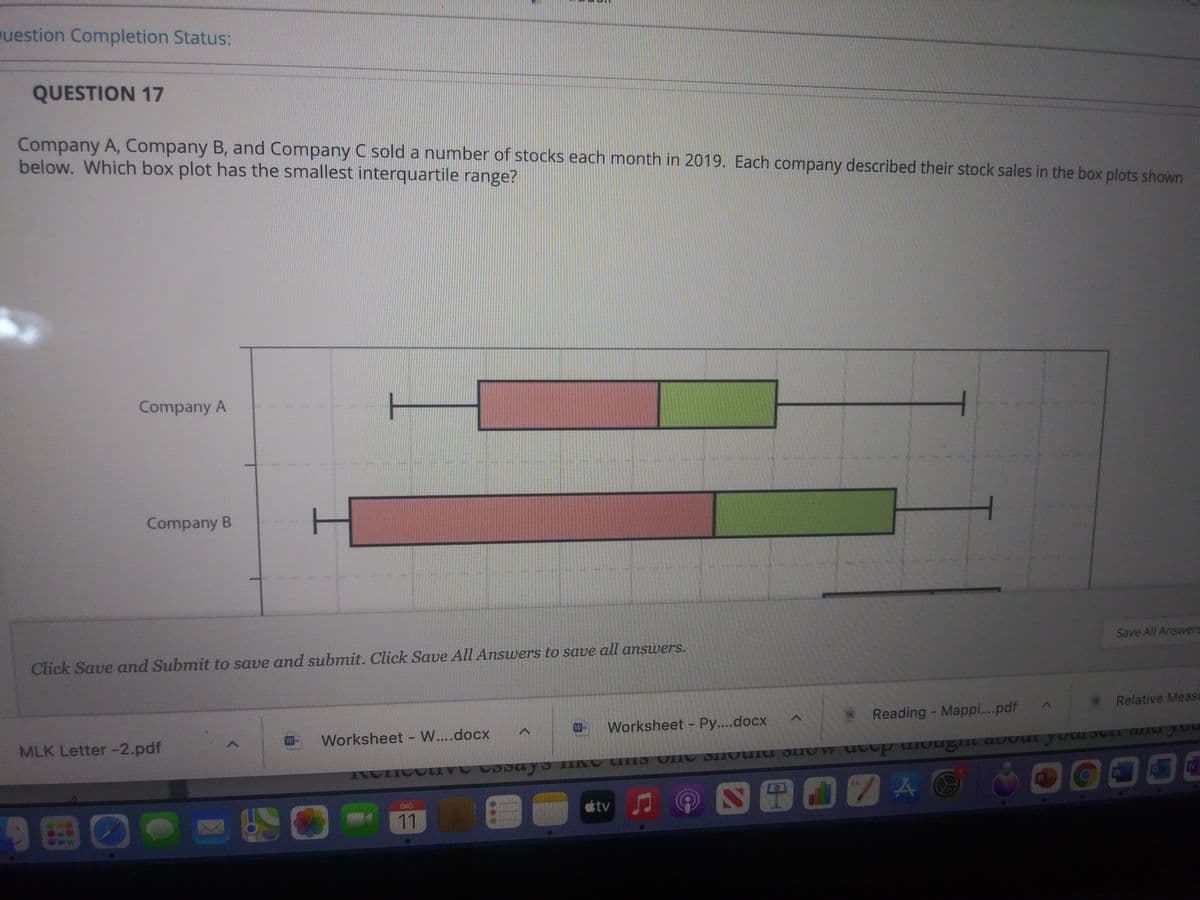
QUESTION 17 Company A, Company B, and Company C sold a number of stocks each month in 2019. Each company described their stock sales in the box plots shown below. Which box plot has the smallest interquartile range?
QUESTION 17 Company A, Company B, and Company C sold a number of stocks each month in 2019. Each company described their stock sales in the box plots shown below. Which box plot has the smallest interquartile range?

Algebra & Trigonometry with Analytic Geometry
13th Edition
ISBN:9781133382119
Author:Swokowski
Publisher:Swokowski
Chapter9: Systems Of Equations And Inequalities
Section9.3: Systems Of Inequalities
Problem 13E

Related questions
Question
Transcribed Image Text:uestion Completion Status:
QUESTION 17
Company A, Company B, and Company C sold a number of stocks each month in 2019. Each company described their stock sales in the box plots shown
below. Which box plot has the smallest interquartile range?
Company A
Company B
Save All Answers
Click Save and Submit to save and submit. Click Save All Answers to save all answers.
Relative Meast
Worksheet -Py....docx
* Reading - Mappi.pdf
MLK Letter -2.pdf
W
Worksheet - W....docx
DIC.
étv J
11
Expert Solution
This question has been solved!
Explore an expertly crafted, step-by-step solution for a thorough understanding of key concepts.

This is a popular solution!

Trending now
This is a popular solution!

Step by step
Solved in 2 steps

Recommended textbooks for you
Algebra & Trigonometry with Analytic Geometry
Algebra
ISBN:
9781133382119
Author:
Swokowski
Publisher:
Cengage
Algebra & Trigonometry with Analytic Geometry
Algebra
ISBN:
9781133382119
Author:
Swokowski
Publisher:
Cengage