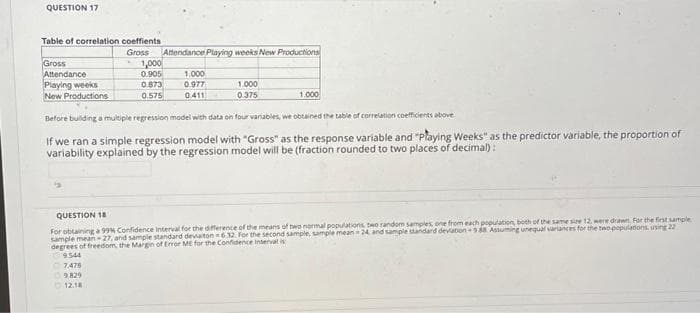
QUESTION 17 Table of correlation coeffients Gross Gross Attendance Playing weeks New Productions Attendance Playing weeks New Productions 1,000 0.905 0.873 0.575 1.000 0 977 0411 1.000 0 375 1.000 Before building a multiple regression model wth data on four variables, we obtained the table of correlation coefficents above If we ran a simple regression model with "Gross" as the response variable and "Playing Weeks" as the predictor variable, the proportion of variability explained by the regression model will be (fraction rounded to two places of decimal):
QUESTION 17 Table of correlation coeffients Gross Gross Attendance Playing weeks New Productions Attendance Playing weeks New Productions 1,000 0.905 0.873 0.575 1.000 0 977 0411 1.000 0 375 1.000 Before building a multiple regression model wth data on four variables, we obtained the table of correlation coefficents above If we ran a simple regression model with "Gross" as the response variable and "Playing Weeks" as the predictor variable, the proportion of variability explained by the regression model will be (fraction rounded to two places of decimal):

College Algebra
7th Edition
ISBN:9781305115545
Author:James Stewart, Lothar Redlin, Saleem Watson
Publisher:James Stewart, Lothar Redlin, Saleem Watson
Chapter1: Equations And Graphs
Section: Chapter Questions
Problem 10T: Olympic Pole Vault The graph in Figure 7 indicates that in recent years the winning Olympic men’s...

Related questions
Question
6
Transcribed Image Text:QUESTION 17
Table of correlation coeffients
Attendance Playing weeks New Productions
1,000
Gross
Gross
Attendance
Playing weeks
New Productions
1.000
0.977
041
0.905
0.873
0.575
1.000
0.375
1.000
Before bulding a multiple regression model with data on four variables, we obtained the table of correlation coefficients above
If we ran a simple regression model with "Gross" as the response variable and "Playing Weeks" as the predictor variable, the proportion of
variability explained by the regression model will be (fraction rounded to two places of decimal):
QUESTION 18
For obtaining a 99% Confidence Interval for the diference of the means of two normal populations two random samples one from each population, both of the same sire 12, were drawn. For the fint sample
sample mean -27, and sample standard devaiton632. For the second sample, sample meanin 24 and sample standard devation-9 Assuming unequal variances for the twopopulatons using 22
degrees of freedom the Margn of Error ME for the Confidence Interval is
9544
7476
9.829
O 12.18
Expert Solution
This question has been solved!
Explore an expertly crafted, step-by-step solution for a thorough understanding of key concepts.

Step by step
Solved in 2 steps

Recommended textbooks for you
College Algebra
Algebra
ISBN:
9781305115545
Author:
James Stewart, Lothar Redlin, Saleem Watson
Publisher:
Cengage Learning

Functions and Change: A Modeling Approach to Coll…
Algebra
ISBN:
9781337111348
Author:
Bruce Crauder, Benny Evans, Alan Noell
Publisher:
Cengage Learning

Glencoe Algebra 1, Student Edition, 9780079039897…
Algebra
ISBN:
9780079039897
Author:
Carter
Publisher:
McGraw Hill
College Algebra
Algebra
ISBN:
9781305115545
Author:
James Stewart, Lothar Redlin, Saleem Watson
Publisher:
Cengage Learning
Functions and Change: A Modeling Approach to Coll…
Algebra
ISBN:
9781337111348
Author:
Bruce Crauder, Benny Evans, Alan Noell
Publisher:
Cengage Learning
Glencoe Algebra 1, Student Edition, 9780079039897…
Algebra
ISBN:
9780079039897
Author:
Carter
Publisher:
McGraw Hill