Question 2: Two opposing provincial members of parliament are debating the merits of increasing funding for education. The member representing the opposition party claims that additional funding will reduce failure rate, while the goverming member maintains that this is not evident. The opposition member presents the following data to support her claim, taken from eight cities in the province. 5.2 9.8 6.1 Operating Budget (millions/year) Number of graduates (hundreds) 7.3 3.5 16.4 2.8 6.6 13 16 25 74 8.5 17 15 Perform a two-variable data analysis to determine if increased funding for education will reduce the failure rate. Note: Use excel or google sheets only to create graphs and calculations. The following should be included in your answer: • Scatter plot(s) including line of best fit and correlation coefficient. • Classification of the lincar correlation and type of causal relationship. • Extrancous variables that may affect either variable. Any possible bias? • Does your statistical analysis support either claim being made by the political party? • Conclusions based on your data analysis. Is there sufficient enough data and information presented to make conclusions?
Question 2: Two opposing provincial members of parliament are debating the merits of increasing funding for education. The member representing the opposition party claims that additional funding will reduce failure rate, while the goverming member maintains that this is not evident. The opposition member presents the following data to support her claim, taken from eight cities in the province. 5.2 9.8 6.1 Operating Budget (millions/year) Number of graduates (hundreds) 7.3 3.5 16.4 2.8 6.6 13 16 25 74 8.5 17 15 Perform a two-variable data analysis to determine if increased funding for education will reduce the failure rate. Note: Use excel or google sheets only to create graphs and calculations. The following should be included in your answer: • Scatter plot(s) including line of best fit and correlation coefficient. • Classification of the lincar correlation and type of causal relationship. • Extrancous variables that may affect either variable. Any possible bias? • Does your statistical analysis support either claim being made by the political party? • Conclusions based on your data analysis. Is there sufficient enough data and information presented to make conclusions?

Functions and Change: A Modeling Approach to College Algebra (MindTap Course List)
6th Edition
ISBN:9781337111348
Author:Bruce Crauder, Benny Evans, Alan Noell
Publisher:Bruce Crauder, Benny Evans, Alan Noell
Chapter5: A Survey Of Other Common Functions
Section5.3: Modeling Data With Power Functions
Problem 6E: Urban Travel Times Population of cities and driving times are related, as shown in the accompanying...

Related questions

Concept explainers
Contingency Table
A contingency table can be defined as the visual representation of the relationship between two or more categorical variables that can be evaluated and registered. It is a categorical version of the scatterplot, which is used to investigate the linear relationship between two variables. A contingency table is indeed a type of frequency distribution table that displays two variables at the same time.
Binomial Distribution
Binomial is an algebraic expression of the sum or the difference of two terms. Before knowing about binomial distribution, we must know about the binomial theorem.
Topic Video
Question
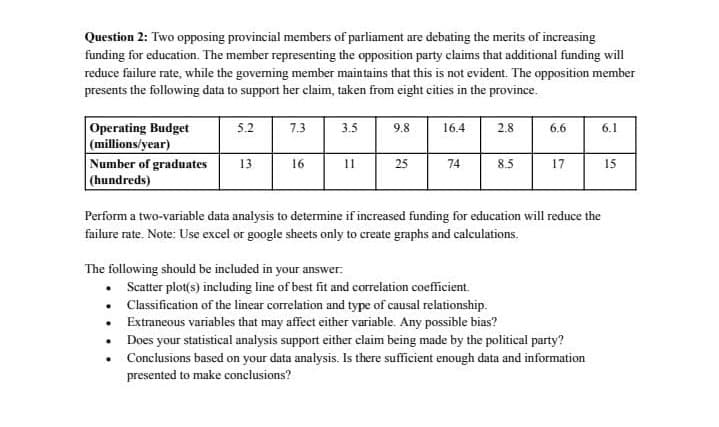
Transcribed Image Text:Question 2: Two opposing provincial members of parliament are debating the merits of increasing
funding for education. The member representing the opposition party claims that additional funding will
reduce failure rate, while the governing member maintains that this is not evident. The opposition member
presents the following data to support her claim, taken from eight cities in the province.
5.2
7.3
3.5
Operating Budget
(millions/year)
Number of graduates
| (hundreds)
9.8
16.4
2.8
6.6
6.1
13
16
11
25
74
8.5
17
15
Perform a two-variable data analysis to determine if increased funding for education will reduce the
failure rate. Note: Use excel or google sheets only to create graphs and calculations.
The following should be included in your answer:
• Scatter plot(s) including line of best fit and correlation coefficient.
• Classification of the linear correlation and type of causal relationship.
Extraneous variables that may affect either variable. Any possible bias?
• Does your statistical analysis support either claim being made by the political party?
Conclusions based on your data analysis. Is there sufficient enough data and information
presented to make conclusions?
Expert Solution
This question has been solved!
Explore an expertly crafted, step-by-step solution for a thorough understanding of key concepts.

Step by step
Solved in 2 steps with 1 images

Knowledge Booster


Learn more about
Need a deep-dive on the concept behind this application? Look no further. Learn more about this topic, statistics and related others by exploring similar questions and additional content below.Recommended textbooks for you
Functions and Change: A Modeling Approach to Coll…
Algebra
ISBN:
9781337111348
Author:
Bruce Crauder, Benny Evans, Alan Noell
Publisher:
Cengage Learning

Linear Algebra: A Modern Introduction
Algebra
ISBN:
9781285463247
Author:
David Poole
Publisher:
Cengage Learning

Glencoe Algebra 1, Student Edition, 9780079039897…
Algebra
ISBN:
9780079039897
Author:
Carter
Publisher:
McGraw Hill
Functions and Change: A Modeling Approach to Coll…
Algebra
ISBN:
9781337111348
Author:
Bruce Crauder, Benny Evans, Alan Noell
Publisher:
Cengage Learning
Linear Algebra: A Modern Introduction
Algebra
ISBN:
9781285463247
Author:
David Poole
Publisher:
Cengage Learning
Glencoe Algebra 1, Student Edition, 9780079039897…
Algebra
ISBN:
9780079039897
Author:
Carter
Publisher:
McGraw Hill