Question-2: You are interested in determining what factors influence the price of a stock. After some examination, a statistician hypothesized that a stock price (Y in $) would be affected by its quarterly dividends (X1 in S), its price/earnings ratio (X2), and the interest rate of treasury bills (X3 in %). The values of the relevant variables were observed for a period of 40 quarters. When the data were run on Excel, the following partial printout was created. Multiple Regression Analysis Parameter Estimate SE t-Statistic Constant 17.3925 ? 5.5254 7.5016 ? 5.5054 X1 X2 X3 -0.4158 0.57091 0.5228 ? ? 1.3982 Analysis of Variance Source Sum of Squares Df Mean Square F-Ratio Model Residual ? ? ? ? ? 180.095 ? Total 697.040 ? R-squared = ? Adjusted R-Squared = ?
Question-2: You are interested in determining what factors influence the price of a stock. After some examination, a statistician hypothesized that a stock price (Y in $) would be affected by its quarterly dividends (X1 in S), its price/earnings ratio (X2), and the interest rate of treasury bills (X3 in %). The values of the relevant variables were observed for a period of 40 quarters. When the data were run on Excel, the following partial printout was created. Multiple Regression Analysis Parameter Estimate SE t-Statistic Constant 17.3925 ? 5.5254 7.5016 ? 5.5054 X1 X2 X3 -0.4158 0.57091 0.5228 ? ? 1.3982 Analysis of Variance Source Sum of Squares Df Mean Square F-Ratio Model Residual ? ? ? ? ? 180.095 ? Total 697.040 ? R-squared = ? Adjusted R-Squared = ?

Algebra & Trigonometry with Analytic Geometry
13th Edition
ISBN:9781133382119
Author:Swokowski
Publisher:Swokowski
Chapter5: Inverse, Exponential, And Logarithmic Functions
Section5.3: The Natural Exponential Function
Problem 40E

Related questions
Topic Video
Question
ANSWER THE FOLLOWING QUESTION.
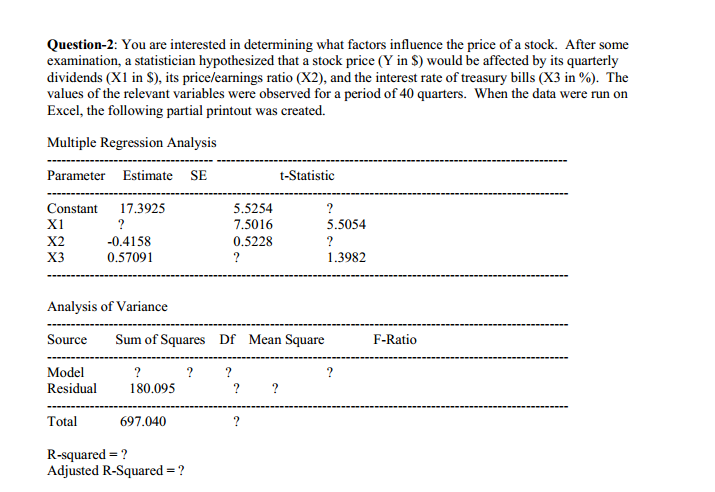
Transcribed Image Text:Question-2: You are interested in determining what factors influence the price of a stock. After some
examination, a statistician hypothesized that a stock price (Y in $) would be affected by its quarterly
dividends (X1 in $), its price/earnings ratio (X2), and the interest rate of treasury bills (X3 in %). The
values of the relevant variables were observed for a period of 40 quarters. When the data were run on
Excel, the following partial printout was created.
Multiple Regression Analysis
Parameter Estimate SE
t-Statistic
Constant
17.3925
5.5254
?
X1
?
7.5016
5.5054
X2
-0.4158
0.5228
?
X3
0.57091
?
1.3982
Analysis of Variance
Source
Sum of Squares Df Mean Square
F-Ratio
Model
?
?
?
Residual
180.095
?
Total
697.040
R-squared = ?
Adjusted R-Squared = ?
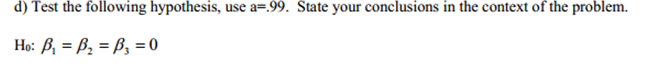
Transcribed Image Text:d) Test the following hypothesis, use a=.99. State your conclusions in the context of the problem.
Ho: B, = Bz = B, = 0
Expert Solution
This question has been solved!
Explore an expertly crafted, step-by-step solution for a thorough understanding of key concepts.

Step by step
Solved in 2 steps with 2 images

Knowledge Booster


Learn more about
Need a deep-dive on the concept behind this application? Look no further. Learn more about this topic, statistics and related others by exploring similar questions and additional content below.Recommended textbooks for you
Algebra & Trigonometry with Analytic Geometry
Algebra
ISBN:
9781133382119
Author:
Swokowski
Publisher:
Cengage

Functions and Change: A Modeling Approach to Coll…
Algebra
ISBN:
9781337111348
Author:
Bruce Crauder, Benny Evans, Alan Noell
Publisher:
Cengage Learning

Algebra & Trigonometry with Analytic Geometry
Algebra
ISBN:
9781133382119
Author:
Swokowski
Publisher:
Cengage
Functions and Change: A Modeling Approach to Coll…
Algebra
ISBN:
9781337111348
Author:
Bruce Crauder, Benny Evans, Alan Noell
Publisher:
Cengage Learning