Question 2. product. The following represents the probability distribution of the daily demand of a Demand Probability 0 10 20 30 0.4 0.2 0.3 1. What is the probability that no units are demanded?
Question 2. product. The following represents the probability distribution of the daily demand of a Demand Probability 0 10 20 30 0.4 0.2 0.3 1. What is the probability that no units are demanded?

Glencoe Algebra 1, Student Edition, 9780079039897, 0079039898, 2018
18th Edition
ISBN:9780079039897
Author:Carter
Publisher:Carter
Chapter10: Statistics
Section10.4: Distributions Of Data
Problem 19PFA

Related questions
Question
J 2
please answer those Q's fastly
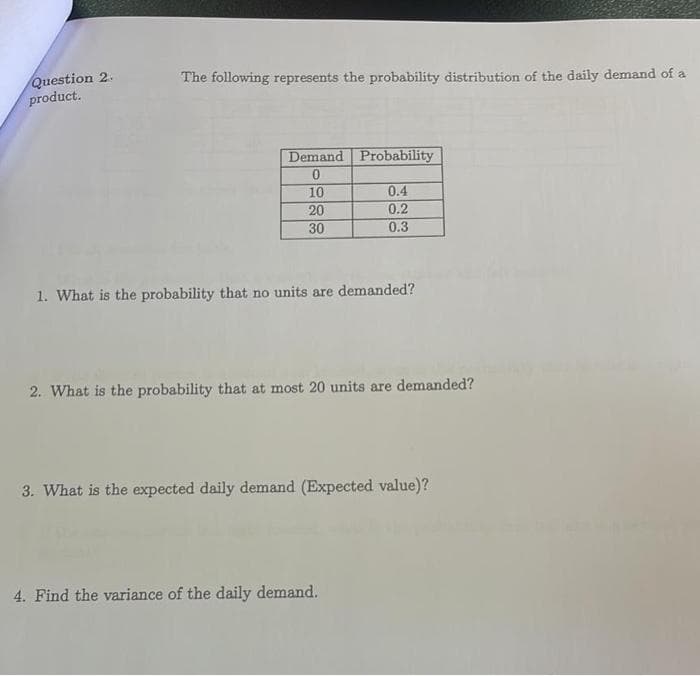
Transcribed Image Text:Question 2.
product.
The following represents the probability distribution of the daily demand of a
Demand Probability
0
10
20
30
0.4
0.2
0.3
1. What is the probability that no units are demanded?
2. What is the probability that at most 20 units are demanded?
3. What is the expected daily demand (Expected value)?
4. Find the variance of the daily demand.
Expert Solution
This question has been solved!
Explore an expertly crafted, step-by-step solution for a thorough understanding of key concepts.

Step by step
Solved in 5 steps

Recommended textbooks for you
Glencoe Algebra 1, Student Edition, 9780079039897…
Algebra
ISBN:
9780079039897
Author:
Carter
Publisher:
McGraw Hill
Glencoe Algebra 1, Student Edition, 9780079039897…
Algebra
ISBN:
9780079039897
Author:
Carter
Publisher:
McGraw Hill