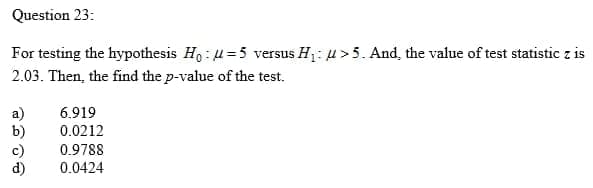
Question 23: For testing the hypothesis Ho: u=5 versus H1: u>5. And, the value of test statistic z is 2.03. Then, the find the p-value of the test. a) b) 6.919 0.0212 0.9788 0.0424


Q: What are the hypotheses for this test? Let Hg be the of the right and left hand reaction times. Họ:…
A: Claim: To test that there is no difference between the reaction times of the right and left hands…
Q: Question 2 A company worries that less than 50% of it's employees have been boosted. They want to…
A:
Q: QUESTION 17 A 95% confidence interval of the mean is (12, 18). The result of testing Ho:u= 14…
A: (17) Confidence interval approach: If the confidence interval contains the population parameter…
Q: Question 12 D In a certain city, the population mean commute time to work was reported as 30…
A: The population mean commute time=μ=30. Claim: μ>30. Sample size=n=35. The sample mean=x¯=31.4.…
Q: A paired difference experiment yielded the results shown below. na = 45 Xd = 16.4 a. Test Ho: Hd =…
A:
Q: Question 23: For testing the hypothesis Ho : H =5 versus H1: u>5. And, the value of test statistic z…
A:
Q: Which of the following accurately represents the null and alternative hypothesis? O Hoi p=0 O Hoi…
A: The test is there would be a significant correlation between job importance and turnover intentions.
Q: 7) Consider the computer output shown below: One-Sample T: Y Test of mu = 91 vs. not = 91 Variable N…
A: It is given that calculated test statistic is,T=3.38 Sample size,N =25 Thus,degree of freedom…
Q: Question 14 You conduct a poll of FIU students in order to determine the percentage of students (p)…
A: Given X=80, n=100,p=0.70 p^=X/n
Q: 2) To ascertain whether a certain die was fair, 1,000 rolls of the die were recorded, with the…
A: Given Level of significance = 0.05 outcome frequency (observed) 1 158 2 172 3 164 4 181…
Q: Question 2 A company worries that less than 50% of it's employees have been boosted. They want to…
A:
Q: QUESTION 8 Find the P-value for the indicated hypothesis test. An article in a journal reports that…
A: The p-value or the probability value helps to decide whether the null hypothesis is rejected or fail…
Q: For a hypothesis test of Ho :µ = 75 versus HA : µ # 75: • The given sample has a test statistic of…
A: here use given null , alternate and test statistic value for p value
Q: QUESTION 16 A 95% confidence interval of the mean is (13, 19). The result of testing Ho: u=15…
A:
Q: Part 2 of 4 (b) Compute the P-value. Round the answer to at least four decimal places. P-value =
A: The difference is, After 3 days After 6 days Difference 1326 1316 10 1366 1351 15 1372 1367…
Q: Question 1. In a Tukey test comparing SEVEN means in distances travelled by Bar-tailed Godwits…
A: Given that, MSE = 124.427 Error df = 56. Treatment = 9. Now, Standard error = MSE / Treatment…
Q: Question 7 out of 9. Using these data below, what is the t statistic for a single-sample t test…
A: As the population standard deviation is unknown, the sample standard deviation must be used while…
Q: ns 3 and 9, were selected from two no t the null hypothesis that the two popu sed on these two…
A: Given : For Sample 1 x̄1 = 78.0 s1 = 3.0 n1 = 6 For Sample 2 x̄2 =…
Q: Question 7 out of 9. Using these data below, what is the t statistic for a single-sample t test…
A:
Q: Which of the following statement is CORRECT? A. If the null hpothesis is false, the sample means…
A: In hypothesis testing the null hypothesis states that there is no difference between the population…
Q: QUESTION 12 Provide an appropriate response. Suppose you want to test the claim that u > 25.6. Given…
A: Given : Claim : u > 25.6
Q: Some tests were carried out on a newly designed carburetor. Four variables were studied as follows:
A: Given information: The variables in the given study are: A = Tension on spring B = Air gap C = Size…
Q: Question 7 out of 9. Using these data below, what is the t statistic for a single-sample t test…
A:
Q: The test statistic for testing HO: mu = 100 against Ha: mu != 100 was t = 3.3, with p-value of…
A:
Q: 6. Find p-value for testing Ho: ß1 0 and Ha: B1 + 0. Test hypothesis at a = .1,.05, and .01 7. Find…
A:
Q: = 5. Two types of plastic are suitable for use by an electronic calculator manufacturer. The…
A: Solution: Given information: n1= 10n2= 12y1= 162.5y2= 155.0σ1=σ2=1.0α=0.01
Q: assistance finding cohen's d and stating null/alt hypothesi
A: Here, for part (c) we have to compute 95% confidence interval. Mean of the given observations(x¯)…
Q: (a) µ represents the population mean of children in Oklahoma. (b) State the hypotheses (Ho & Ha) for…
A: The claim is the mean hemoglobin of children in his city is different than 12.
Q: 18. A test of the hypotheses Ho: =0 vs. H.: p>0 was conducted using a sample size of 7. The test…
A: Null and the alternative hypothesis: The value of test statistic is, t = 1.935. Degree of freedom:
Q: Question 23: For testing the hypothesis Ho : u = 5 versus H1: µ > 5. And, the value of test…
A: Given
Q: Consider the hypotheses shown below. Given that x overbarx=57, sigmaσ=12, n=35, alphaα=0.05,…
A: Given information- Population mean, μ = 55 Population standard deviation, σ = 12 Sample size, n = 35…
Q: Question 23: For testing the hypothesis Ho : H=5 versus H1: u>5. And, the value of test statistic z…
A: From the alternative hypothesis, it is seen that it is a right tailed test.
Q: QUESTION 16 A 95% confidence interval of the mean is (12, 18). The result of testing Ho:u=14against…
A: Given 95% CI for people mean is (12,18) Hypothesis Ho:μ=14 vs H1: μ≠ 14
Q: The process of drawing conclusions about a population on the basis of measurements or observations…
A: Given Information: The process of drawing conclusions about a population on the basis of…
Q: A test of the null hypothesis Ho: 4 = lo gives a test statistic of z = 1.37. What is the P-value if…
A: Statistical hypothesis testing is an important method in inferential statistics. It is used to test…
Q: QUESTION 1 If the alternate hypothesis states that u 4,000, where is the rejection region for the…
A:
Q: The null and alternative hypotheses associated with the test statistic in Equation 11-26 are Ho: ß1…
A: The null hypothesis States that the slope is equal to zero , The alternative hypothesis States that…
Q: Given Ho: u = 10 and HA: H> 10 and the p-value = 0.04, determine the conclusion of the test at the…
A: p-value = 0.04 u = 10
Q: QUESTION 12 Suppose we are interested in whether travelers departing to Bali have spent researching…
A:
Q: QUESTION 7 If there is a perfect association between X and Y, the would equal 00. o corelation…
A: From the given information, it is clear that, If there is a perfect correlation (whether positive or…
Q: Score: 0 of 1 pt 9 of 28 (13 complete) Instructor-created question Course Note Packet Chapter 9 Page…
A:
Q: QUESTION 20 A 95% confidence interval of the mean is (10, 15). The result of testing H u=12 againstH…
A: Given that the confidence interval is (10, 15) μ=12 lies in this interval. So this supports the…
Q: Question 13 Two possible p-values are given. Which one provides the strongest evidence against H0?…
A: Give, p- value = 0.03 p- value = 0.0007
Q: QUESTION 16 A 95% confidence interval of the mean is (12, 18). The result of testing Ho:u=14 against…
A: As per guidelines expert have to answer first question only.dear student please upload other…
Q: Question 8 An Fstatistic calculated on 3 and 48 degrees of freedom equals 4.23. Which decision would…
A: Given F statistic=4.23 at df1=3 and df2=48 Level of significance=0.05 From option it is clear…
Q: The calculated value for your Chi Square crosstabulation comes in at 9.888. The test has 4 degrees…
A: From the information, given that the value of the test statistic is 9.888 and the degrees of freedom…
Q: QUESTION 25 In a test of hypothesis at a significance level of 1%, the p-value is 0.0029. What is…
A: Given Level of significance=alpha=1%=0.01 P-value=0.0029
Q: Find the mean and standard deviation of the sampling distribution of x bar. u x = _________ Qx =…
A:
Q: Consider the follovwing hypothesis test: Họ: p 2 0.75 Ha: p< 0.75 sample of 300 items was selected.…
A: The probability of observing under H0 a sample outcome at least as extreme as the one observed is…
Q: QUESTION 6 Which of the following P-values will lead us to reject the null hypothesis at the .05…
A: Here AS PER POLICY I HAVE CALCULATED FIRST MAIN QUESTION PLZ REPOST FOR REMAINING HERE use…


Trending now
This is a popular solution!

Step by step
Solved in 2 steps with 2 images


- Based on the information provided in the image, what is the result of your hypothesis test (a=0.01, one tail)?Question 16 The p-value for a hypothesis test turns out to be 0.08969. At a 9% level of significance, what is the proper decision? Reject H0H0 Fail to reject H0Question 16 A null hypothesis H0 was rejected at the significance level = 0.10. What will the result of the hypothesis test be at the significance level = 0.05?
- Suppose that a random sample of size 1 is to be taken from a finite population of size N. a. How many possible samples are there?b. Identify the relationship between the possible sample means and the possible observations of the variable under consideration.c. What is the difference between taking a random sample of size 1 from a population and selecting a member at random from the population?The table below summarizes data from a survey of a sample of women. Using a 0.01significance level, and assuming that the sample sizes of 800 men and 300 women are predetermined, test the claim that the proportions of agree/disagree responses are the same for subjects interviewed by men and the subjects interviewed by women. Does it appear that the gender of the interviewer affected the responses of women? Gender of Interviewer Man Woman Women who agree 498 247 Women who disagree 302 53 Compute the test statistic, rounding to three decimal places. Find the critical value(s). (Round to three decimal places) What is the conclusion based on the hypothesis test?Two sample sizes of 15 and 10 were taken from a male and a female population, respectively. What is the corresponding degrees of freedom of the given samples?
- Calculate the statistic needed to test the hypothesis stated in Question 11 based on your sample of 1,000 throws of a goat astragalus.1. Using all 1991 birth records in the computerized national birth certificate registry compiled by the National Center for Health Statistics (NCHS), statisticians Traci Clemons and Marcello Pagano found that the birth weights of babies in the United States are not symmetric ("Are babies normal?" The American Statistician, Nov 1999, 53:4). However, they also found that when infants born outside of the "typical" 37-43 weeks and infants born to mothers with a history of diabetes are excluded, the birth weights of the remaining infants do follow a Normal model with mean μ = 3432 g and standard deviation σ = 482 g. The following questions refer to infants born from 37 to 43 weeks whose mothers did not have a history of diabetes.Compute the z-score of an infant who weighs 2002 g. (Round your answer to two decimal places.)?Approximately what fraction of infants would you expect to have birth weights between 2880 g and 4040 g? (Express your answer as a decimal, not a percent, and round to…As a result of dog breeding for certain physical traits, many dog breeds have changed in the last 100 years. A dog breeder wants to measure the effects of breeding on the face length of the boxer breed using a hypothesis test. Suppose that the dog breeder has face length measurements (in inches) from a random sample of 40 female boxer dogs taken in 1915 and a random sample of 40 female boxer dogs taken in 2015. Which type of hypothesis test should the breeder use? Reference: Elegans, C. 100 Years of Breed Improvement. 2012. Dog Behavior Science. Retrieved from: https://dogbehaviorscience.wordpress.com/2012/09/29/100-years-of-breed-improvement Test for one population proportion Test for one population mean Test for a difference in two population proportions Test for a difference in two population means
- (c) 100 males and 100 females are asked a series of question to determine whether that are considered heavy drinkers or not.45 of males are considered heavy drinkers.56 of females are classified as heavy drinkers .execute a hypothesis test as to whether there is relationship between gender and drinking at alpha 0.05.The table below shows results from a recent General Social Survey on two variables, respondent sex and whether one believes in an afterlife. compare the population proportions of women and men who believe in an afterlife. State the hypotheses, calculate the test statistic, and write your conclusions, using α = 0.05. Belief in Afterlife Sex Yes No or Undecided Total Male 375 134 509 Female 435 147 582 State the hypotheses and which groups you are assigning to and : Let = Let mu1 = Let mu2= H0: Ha:Given Ho: mu> 85 and P= 0.003. What decision should be made at the 0.01 level of significance ? A) fail to reject the bill B) reject the bill C) fail to reject the alternative D) reject the alternative
