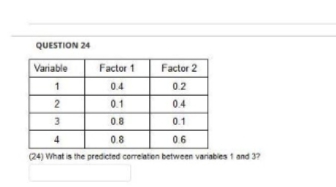
QUESTION 24 Variable Factor 1 Factor 2 04 02 2 0.1 04 3 08 0.1 08 06 24) What is the predicted cereiatien between variables 1 and 37


Q: 3 m 7) Determine the location of centroid (x, ỹ ) of the cross-sectional area shown (P9-69) 1.2 m 3…
A:
Q: 7. The motion of microscopic particles in a liquid or gas is irregular, because the particles…
A: Given that, the particle at the origin (0,0,0) of the coordinate system at time t=0 and particle…
Q: As part of a sales strategy, 20% of randomly chose new internet service subscribers receive a…
A: Given,n=6p=0.2q=1-0.2=0.8A random variable X~Binomial(n=6, p=0.2)P(X=x)=6x0.2x0.86-x ;…
Q: e height of a randomly c ariance of X, we observe ne distribution as X. We 166.8, 171. ues of the…
A: The question is about descriptive statistics Given data :
Q: A high school has 40 players on the football team. The summary of the players' weights is given in…
A:
Q: An analogue signal received at a detector, measured in microvolts, is normally distributed with mean…
A: Given that mean =200 ,s.d =16
Q: The U.S. Center for Disease Control reports that the mean life expectancy was 47.6 years for whites…
A: From the provided information,
Q: Product Name Product ID Quantity Cost Milk МО01 10 340 Bread B987 23 450 Coffee CF0003 20 230 Tea…
A: Descriptive statistics are summarized statistics of any data set.
Q: Problem Five: Dorian makes luxury cars and jeeps for high-income men and women. It wishes to…
A:
Q: Does the source of medical information affect people’s confidence that it is true
A: Vaccinations are wont to boost your system by teaching your body the way to fight threats. such a…
Q: Sam is practising free-throws in basketball. She has a 4/5 chance of scoring each time she shoots…
A:
Q: Below is a table containing the Annual Expenditure per family in the different regions of the…
A:
Q: tion of 1.4. In 2014, it is estimated that 8.5% of people aroun g questions: whether the…
A: *Answer:
Q: According to the Oxnard College Student Success Committee report in the previous year, we believe…
A: Given information: Confidence level is 95%. Significance level is 5%. From the standard normal…
Q: 5. Ten analyses of the concentration of albumin gave a mean of 20.92 g/1 and a standard deviation of…
A: Given that Sample size n =10 Sample mean =20.92 Standard deviation =0.45 NOTE:- According to…
Q: Problem Five: Dorian makes luxury cars and jeeps for high-income men and women. It wishes to…
A:
Q: There are 88 students at the dance studio and 10 of them will be selected at random for cleaning…
A:
Q: Referring to Table 10-1, at the α = 0.10 level, the correct critical value(s) is (are)
A: From the given table, Sample size for loction 1, n1 = 20 Sample size for location 2, n2 = 20
Q: A group of researchers wants to do a comparative study on auditory reaction time (ART) and visual…
A: (a) The objective is to test whether Arts majors tend to perform better in the VRT task rather than…
Q: Help me answer the questions in the pictures with the following information below: Weatherwise is a…
A:
Q: Given the distribution table below: Number of Students 12 Less than cumulative frequency (cf) Number…
A: The formula to find the 75% percentile value (P75) from the Grouped data is defined by as shown…
Q: Express the confidence interval 75.9 % <p < 93.7 % in the form p + MoE. Here, "MoE" means "Margin of…
A: Given information: 75.9%<p<93.7%
Q: Table 1 22 33 37 53 57 69 85 102 106 112 23 33 38 53 59 70 86 104 107 112 24 35 41 54 61 70 101 105…
A: Solution-: We have following data:…
Q: Calculate the following data: 1,14,12,10,15,8 Calculate the value of the sample standard…
A:
Q: High Temperatures (in °F) for Wichita, KS from September 88 73 84 80 68 66 82 87 80 73 67 65 64 82…
A: Given the data 88 73 84 80 68 66 82 87 80 73 67 65 64 82 88 78 89 84 72 63
Q: Let x be a random variable that represents the pH of arterial plasma (i.e., acidity of the blood).…
A: a. Consider that μ is the population mean pH level of the blood.
Q: Two coworkers commute from the same building. They are interested in whether or not there is any…
A:
Q: 5,179 6,181 6,154 6,132 6,104 6,117 k model with drift and normally distributed
A:
Q: What is the order of the graph? B E Figure 1 O C)6 O B) 5 O A) 4 O D) 7
A: Given problem Given that What is the order of the graph ? Ans) C) 6
Q: Find the mean, ?, and standard deviation, ?, for a binomial random variable X. (Round all answers…
A:
Q: A simple random sample of 30 men from a normally distributed population results in a standard…
A: Solution:- from given information sample size n=30 standard deviation s=8.7 claim: The pulse rates…
Q: est significance of r at the 5% and at the 1%
A:
Q: What is the expected value of the number of free-throws that Sam will score before her first miss?…
A: Given: Probability of scoring each time she shoots from the free-throw line is, p=45
Q: Imagine a company wants to test the claim that their batteries last more than 40 hours. Using a…
A: Solution-: Given: μ0=40,n=15,x¯=44.9,s=8.9,α=0.05 Claim: The company wants to test the claim that…
Q: Examine the output and discuss whether there is a statistically significant relationship between the…
A: Given the results of a chi- square test. We have to examine the output and discuss whether there is…
Q: . Find the areas under the normal curve. A. Right of z = 2.13 B. Left of z = -1.03 C. Right of z =…
A:
Q: er than the mean age in the United States? Test at a 1% significance level. Solve the following…
A: Given Data : For Sample 1 x̄1 = 18 s1 = 6 n1 = 100 For Sample 2 x̄2 = 20…
Q: Question 7 Q.7.1 Explain the difference between a Type I error and a Type Il error. Q.7.2 Explain…
A: A Type I error in statistics is a false positive result, whereas a Type II error is a false negative…
Q: The table below shows the weight (in kilograms) of 30 randomly selected PBA players for the current…
A:
Q: estimator That is and both accurate precise: Parameter
A: Parameter: It may be defined as the statistic or a quantity of the population under study. It is any…
Q: 5. Suppose the average age of family members is 34 with a standard deviation of 4. If 160 members of…
A:
Q: Let 0 denote the probability that a randomly sampled individual in some population voted…
A: Please find the explanation below. Thank you
Q: A magazine collected the ratings for food, decor, service and the cost per person for a sample of 96…
A: Obtain the predicted value of Y when X equals 52. The predicted the value of Y when X equals 52 is…
Q: 2 The concentration of a certain active agent in a liquid form of a pesticide must not exceed 12…
A:
Q: With reference to the following data, find the correlation coefficient and the regression equation…
A: From the provided information, x y 91 58 87 63 75 68 66 71 50 79…
Q: ction of f(A) = when -1 w) where w>0
A:
Q: ther there has been a significant change in the distribution of class between the last school year…
A:
Q: Question 3 UI 12, 3ep 1 UI 3 Correct The following stem-and-leaf plot represents the times in…
A: Data given 21,24,24,25,26,27,27,29,32,35,36,41,41,43,43,43,43,44,47,50,51,52,53,54,55,59
Q: A group of researchers wanted to estimate the proportion of people with type 2 diabetes worldwide.…
A: np and np mus be greater or equal to 10.

Step by step
Solved in 2 steps

- Suppose we want to predict job performance of Chevy mechanics based on mechanical aptitude test scores. Job Performance Mechanical Aptitude 1 40 2 45 1 38 3 50 2 48 3 55 3 53 4 55 4 58 3 40 5 55 3 48 3 45 2 55 4 60 5 60 5 60 5 65 4 50 3 58 6 60 3 45 Test at 0.05 level of significance. Assuming data is normal. Use 2 decimal places. Pick one method to be used: Chi-Square Test Mann Whitney U Test Spearman Rank and Friedman Test Mc Nemar’s Test for Correlated Proportions Kendall’s Coefficient of Concordance W Kolmogorov-Smirnov Test Multiple Regression After picking one method to be used, answer the following: What test method to be used: R: Coefficient of Determination: Slope of the line: Y intercept:The chi square statistics please answer and show work on solving x2 critical value and x2In which situation cointegration test can be performed? Write down its null Also, refer the given table and interpret the results?
- The average drying time of a manufacturer’s paint is 20 minutes. Investigating the effectiveness of a modifica-tion in the chemical composition of her paint, the manu-facturer wants to test the null hypothesis μ = 20 minutes against a suitable alternative, where μ is the average dry-ing time of the modified paint. (a) What alternative hypothesis should the manufactureruse if she does not want to make the modification in thechemical composition of the paint unless it decreases thedrying time?(b) What alternative hypothesis should the manufactureruse if the new process is actually cheaper and she wants tomake the modification unless it increases the drying timeof the paint?Consider the CAPM. The risk-free rate is 6% and the expected return on the market is 18%. What is the expected return on a stock with a beta of 1.3 when market is efficient?A local chess club claims that the length of time to play a game has a mean of 43 minutes or more. Write sentences describing type I and type II errors for a hypothesis test of this claim. A type I error will occur if the actual mean of the length of time to play a game is ▼ equal to less than or equal to not equal to greater than or equal to greater than less than 43 minutes, but you ▼ reject fail to reject the null hypothesis, ▼ Upper H 0 : mu greater than or equals 43H0: μ≥43 Upper H 0 : mu not equals 43H0: μ≠43 Upper H 0 : mu equals 43H0: μ=43 Upper H 0 : mu less than or equals 43H0: μ≤43 Upper H 0 : mu greater than 43H0: μ>43 Upper H 0 : mu less than 43H0: μ<43 . A type II error will occur if the actual mean of the length of time to play a game is ▼ greater than less than or equal to less than greater than or equal to equal to not equal to 43 minutes, but you ▼ fail to reject reject the null hypothesis, ▼ Upper H 0…
- Let X1, ..., Xn be a sample from an exponential population with parameter λ.(a) Find the maximum likelihood estimator for λ. (b) Is the estimator unbiased?(c) Is the estimator consistent?Regarding question 8.) Please let me know why critical point at 95% confidence of t-statistic of df (n1+n2-2) = 32 is 2.034, not +/- 2.73 which is from T-value table.Find kurtosis by using ungroup data given in the picture using quartile deviation, make sure to arrange data before solving question.
- Because the t value you found is _______ , you decide to ________ the null hypothesis. (Note that this conclusion is also supported by the significance reported by SPSS.) Group of answer choices in the critical region, reject in the critical region, accept NOT in the critical region, accept NOT in the critical region, rejectIf null hypothesis is false because a drop has occurred, then the observed z will be?The worldwide market share for a web browser was 20.5% in a recent month. Suppose that a sample of 240 random students at a certain university finds that 60 use the browser. Complete parts (a) through (d) below. Question content area bottom Part 1 a. At the 0.01 level of significance, is there evidence that the market share for the web browser at the university is greater than the worldwide market share of 20.5%? Determine the null and alternative hypotheses. A. H0: π≤0.205; H1: π>0.205 B. H0: π=0.205; H1: π≠0.205 C. H0: π≠0.205; H1: π=0.205 D. H0: π≥0.205; H1: π<