Question 2(a). The data below provide information about 23 observations taken in a series of different medical treatment for heart diseases patients. The variables patient's heart beat (per minutes). Obs 1 2 3 4 5 6 7 8 9 10 11 12 13 14 15 16 17 18 19 20 21 22 23 patient's heart beat 70.50 77.30 82.22 62.32 77.34 70.54 63.23 87.32 73.35 85.31 67.89 70.90 75.31 77.30 86.35 88.14 90.34 65.25 84.21 79.25 60.37 62.21 d) Calculate measures of central location and interpret them e) Calculate the range, the variance and the standard deviation f) Calculate the five-number summary of the data g) Draw the boxplot for the data. Show the five-number summary in the graph, and calculate if there are any outliers in the data
Question 2(a). The data below provide information about 23 observations taken in a series of different medical treatment for heart diseases patients. The variables patient's heart beat (per minutes). Obs 1 2 3 4 5 6 7 8 9 10 11 12 13 14 15 16 17 18 19 20 21 22 23 patient's heart beat 70.50 77.30 82.22 62.32 77.34 70.54 63.23 87.32 73.35 85.31 67.89 70.90 75.31 77.30 86.35 88.14 90.34 65.25 84.21 79.25 60.37 62.21 d) Calculate measures of central location and interpret them e) Calculate the range, the variance and the standard deviation f) Calculate the five-number summary of the data g) Draw the boxplot for the data. Show the five-number summary in the graph, and calculate if there are any outliers in the data

Functions and Change: A Modeling Approach to College Algebra (MindTap Course List)
6th Edition
ISBN:9781337111348
Author:Bruce Crauder, Benny Evans, Alan Noell
Publisher:Bruce Crauder, Benny Evans, Alan Noell
Chapter5: A Survey Of Other Common Functions
Section5.3: Modeling Data With Power Functions
Problem 6E: Urban Travel Times Population of cities and driving times are related, as shown in the accompanying...

Related questions
Question
Transcribed Image Text:Question 2(a).
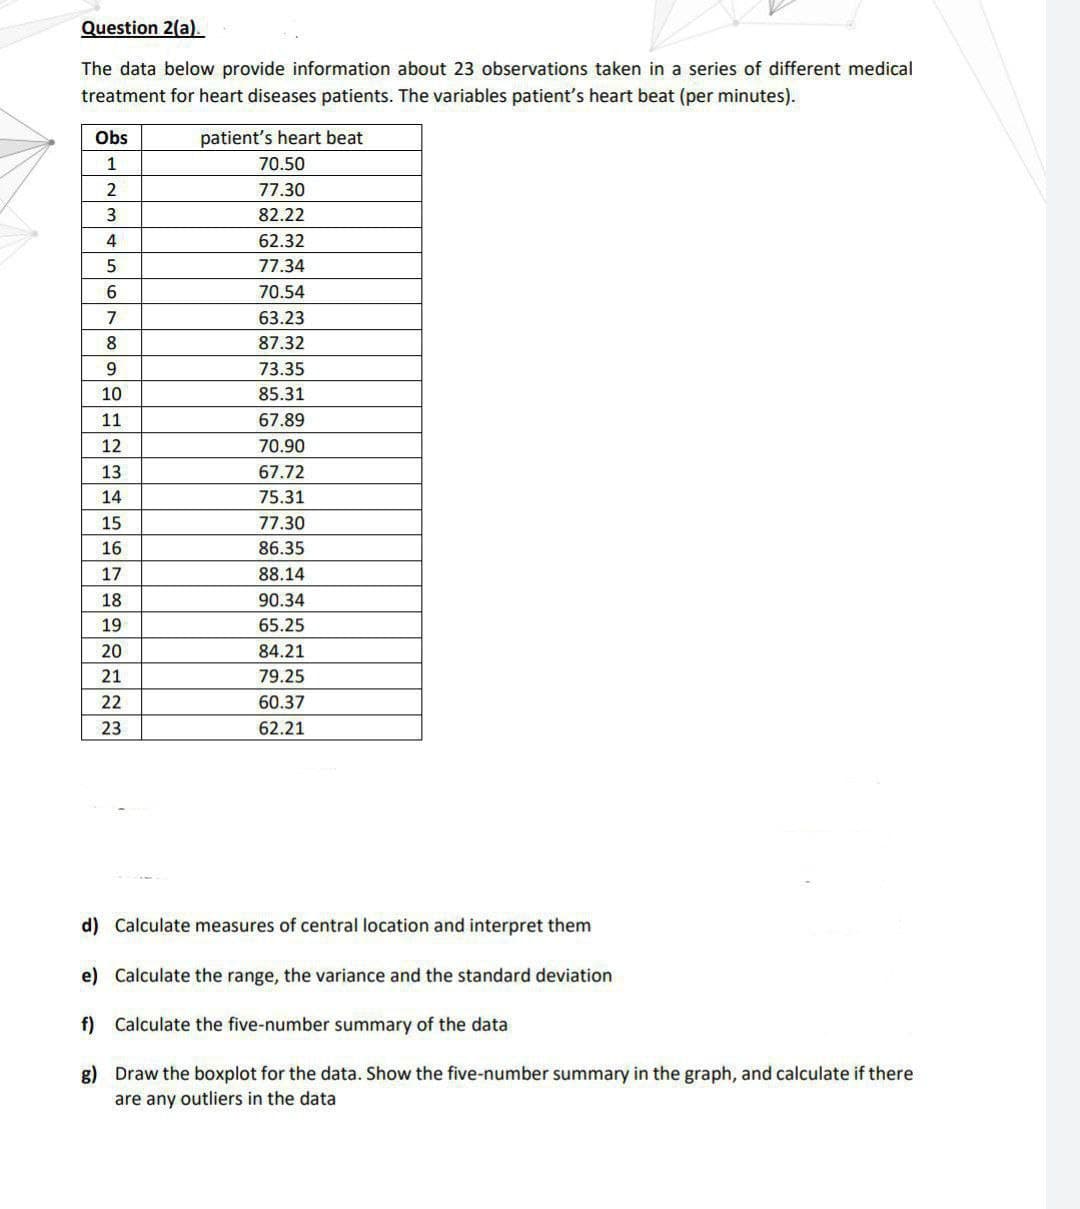
The data below provide information about 23 observations taken in a series of different medical
treatment for heart diseases patients. The variables patient's heart beat (per minutes).
Obs
1
2
3
4
5
6
7
8
9
10
11
12
MASSAGERIE
13
14
15
16
17
18
19
20
21
22
23
patient's heart beat
70.50
77.30
82.22
62.32
77.34
70.54
63.23
87.32
73.35
85.31
67.89
70.90
67.72
75.31
77.30
86.35
88.14
90.34
65.25
84.21
79.25
60.37
62.21
d) Calculate measures of central location and interpret them
e) Calculate the range, the variance and the standard deviation
f) Calculate the five-number summary of the data
g)
Draw the boxplot for the data. Show the five-number summary in the graph, and calculate if there
are any outliers in the data
Expert Solution
This question has been solved!
Explore an expertly crafted, step-by-step solution for a thorough understanding of key concepts.

Step by step
Solved in 8 steps with 1 images

Recommended textbooks for you
Functions and Change: A Modeling Approach to Coll…
Algebra
ISBN:
9781337111348
Author:
Bruce Crauder, Benny Evans, Alan Noell
Publisher:
Cengage Learning

Glencoe Algebra 1, Student Edition, 9780079039897…
Algebra
ISBN:
9780079039897
Author:
Carter
Publisher:
McGraw Hill
Functions and Change: A Modeling Approach to Coll…
Algebra
ISBN:
9781337111348
Author:
Bruce Crauder, Benny Evans, Alan Noell
Publisher:
Cengage Learning
Glencoe Algebra 1, Student Edition, 9780079039897…
Algebra
ISBN:
9780079039897
Author:
Carter
Publisher:
McGraw Hill