Question 3 According to a Kaiser Family Foundation survey, children aged 8 to 18 years in the United States spend an average of 190 minutes per day watching television. A recent random sample of 4 such children showed the following results: 200, 210, 230, 220 (in minutes) At the 5% level of significance, can you conclude that the current mean time spent watching television per day by children in this age group differs from 190 minutes? a)Step 1: State the null and alternative hypotheses. b)Step 2: Write down the appropriate test statistic (formula) , but first check assumptions c) Step 3 :Write down the rejection region of your test.
Question 3 According to a Kaiser Family Foundation survey, children aged 8 to 18 years in the United States spend an average of 190 minutes per day watching television. A recent random sample of 4 such children showed the following results: 200, 210, 230, 220 (in minutes) At the 5% level of significance, can you conclude that the current mean time spent watching television per day by children in this age group differs from 190 minutes? a)Step 1: State the null and alternative hypotheses. b)Step 2: Write down the appropriate test statistic (formula) , but first check assumptions c) Step 3 :Write down the rejection region of your test.

Glencoe Algebra 1, Student Edition, 9780079039897, 0079039898, 2018
18th Edition
ISBN:9780079039897
Author:Carter
Publisher:Carter
Chapter10: Statistics
Section10.4: Distributions Of Data
Problem 19PFA

Related questions
Topic Video
Question
Transcribed Image Text:Question 3
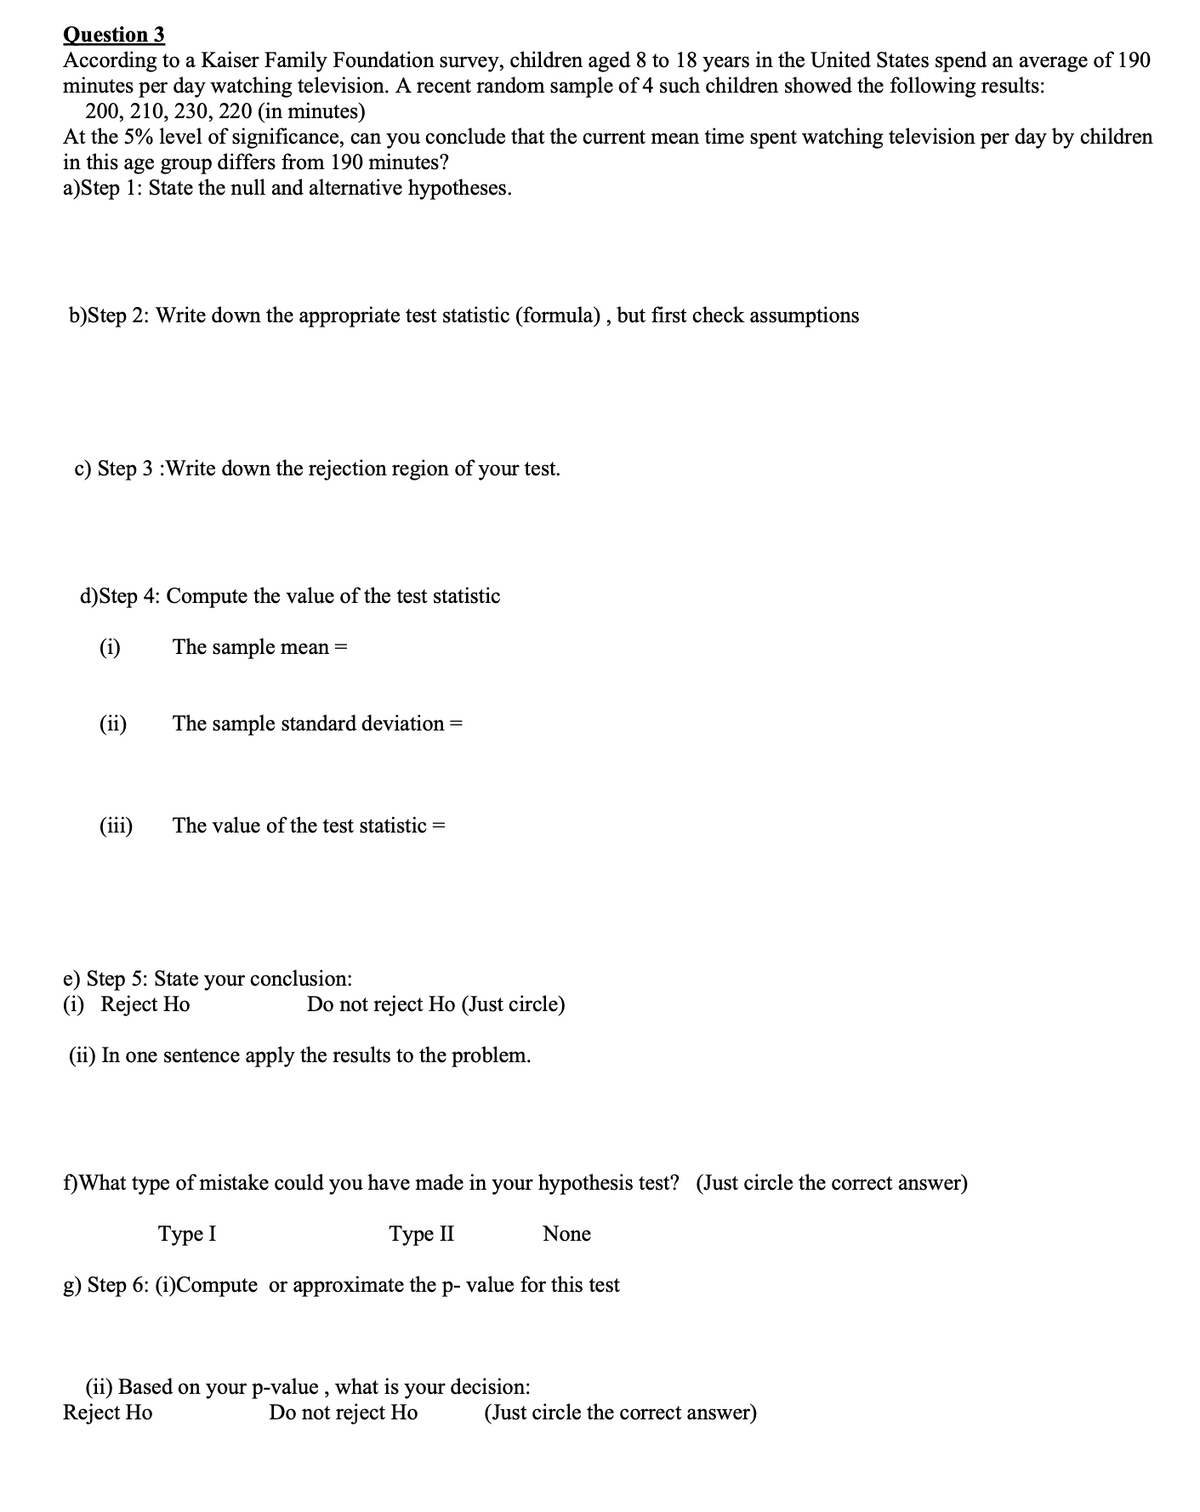
According to a Kaiser Family Foundation survey, children aged 8 to 18 years in the United States spend an average of 190
minutes per day watching television. A recent random sample of 4 such children showed the following results:
200, 210, 230, 220 (in minutes)
At the 5% level of significance, can you conclude that the current mean time spent watching television per day by children
in this age group differs from 190 minutes?
a)Step 1: State the null and alternative hypotheses.
b)Step 2: Write down the appropriate test statistic (formula) , but first check assumptions
c) Step 3 :Write down the rejection region of your test.
d)Step 4: Compute the value of the test statistic
(i)
The sample mean =
The sample standard deviation =
(iii)
The value of the test statistic =
e) Step 5: State
your
conclusion:
(i) Reject Ho
Do not reject Ho (Just circle)
(ii) In one sentence apply the results to the problem.
f)What type of mistake could you have made in your hypothesis test? (Just circle the correct answer)
Туре I
Туре II
None
g) Step 6: (i)Compute or approximate the p- value for this test
(ii) Based on your p-value , what is your decision:
Reject Ho
Do not reject Ho
(Just circle the correct answer)
Expert Solution
This question has been solved!
Explore an expertly crafted, step-by-step solution for a thorough understanding of key concepts.

Step by step
Solved in 3 steps

Knowledge Booster


Learn more about
Need a deep-dive on the concept behind this application? Look no further. Learn more about this topic, statistics and related others by exploring similar questions and additional content below.Recommended textbooks for you
Glencoe Algebra 1, Student Edition, 9780079039897…
Algebra
ISBN:
9780079039897
Author:
Carter
Publisher:
McGraw Hill
Glencoe Algebra 1, Student Edition, 9780079039897…
Algebra
ISBN:
9780079039897
Author:
Carter
Publisher:
McGraw Hill