QUESTION 36 Consider a sample with M= 16 and s O a. The treatment has a large effect size (Cohen's d). = 25. A researcher is testing the null hypothesis that u= 20. Which statement is correct? O b. The treatment has a small effect size (Cohen's d). O C. The treatment has a statistically significant effect. O d. The treatment has a moderate effect size (Cohen's d).
QUESTION 36 Consider a sample with M= 16 and s O a. The treatment has a large effect size (Cohen's d). = 25. A researcher is testing the null hypothesis that u= 20. Which statement is correct? O b. The treatment has a small effect size (Cohen's d). O C. The treatment has a statistically significant effect. O d. The treatment has a moderate effect size (Cohen's d).

Algebra & Trigonometry with Analytic Geometry
13th Edition
ISBN:9781133382119
Author:Swokowski
Publisher:Swokowski
Chapter10: Sequences, Series, And Probability
Section10.8: Probability
Problem 29E

Related questions
Question
questions 36 ?
Transcribed Image Text:O C. at least n = 11
O d. at leastn=13
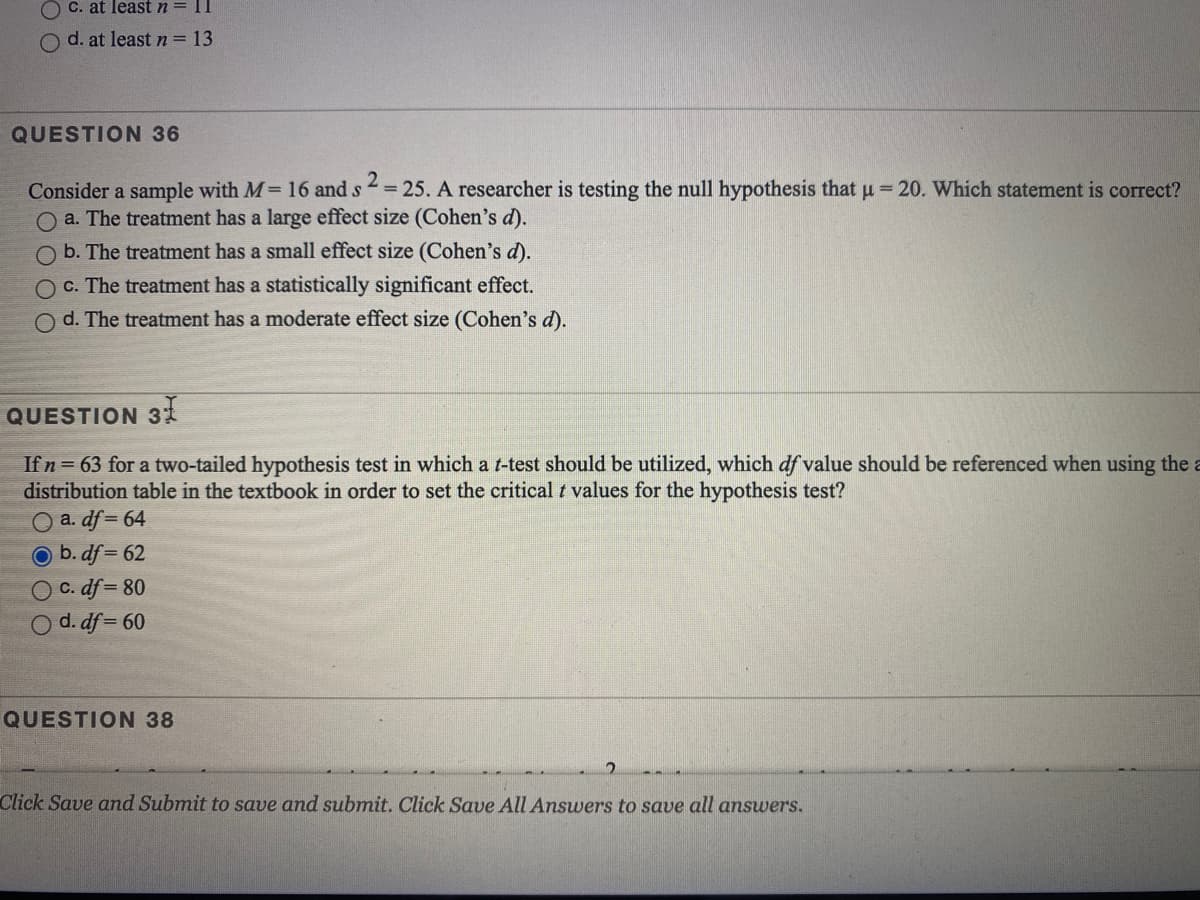
QUESTION 36
= 25. A researcher is testing the null hypothesis that u = 20. Which statement is correct?
Consider a sample with M= 16 and s
O a. The treatment has a large effect size (Cohen's d).
b. The treatment has a small effect size (Cohen's d).
O c. The treatment has a statistically significant effect.
O d. The treatment has a moderate effect size (Cohen's d).
QUESTION 31
If n= 63 for a two-tailed hypothesis test in which a t-test should be utilized, which df value should
distribution table in the textbook in order to set the critical t values for the hypothesis test?
O a. df= 64
referenced when using
b. df = 62
C. df = 80
O d. df = 60
QUESTION 38
Click Save and Submit to save and submit. Click Save All Answers to save all answers.
Expert Solution
This question has been solved!
Explore an expertly crafted, step-by-step solution for a thorough understanding of key concepts.

This is a popular solution!

Trending now
This is a popular solution!

Step by step
Solved in 2 steps

Knowledge Booster


Learn more about
Need a deep-dive on the concept behind this application? Look no further. Learn more about this topic, statistics and related others by exploring similar questions and additional content below.Recommended textbooks for you
Algebra & Trigonometry with Analytic Geometry
Algebra
ISBN:
9781133382119
Author:
Swokowski
Publisher:
Cengage
Algebra & Trigonometry with Analytic Geometry
Algebra
ISBN:
9781133382119
Author:
Swokowski
Publisher:
Cengage