QUESTION 38 A group of students was asked to rate their self-rated health on a scale of 1 (poor) to 4 (excellent). Researchers found a association between their rating at the beginning of the semester (x) and their rating at the end of the semester (y). Res of a regression analysis are provided below. Use the analysis to find the equation of the regression line. Predictor Regression t statistic Coefficient value Constant 3.584756 45.85075 .005 (Intercept) Self-Rated Health 0.090953 4.103932 .003 at Beginning of Semester A) y = 3.584756x+ 0.090953 B) y = 45.85075+0.090953x C) y 3.584756+0.022162x D) y = 3.584756 0.022162x E) y = 3.584756+0.090953x
QUESTION 38 A group of students was asked to rate their self-rated health on a scale of 1 (poor) to 4 (excellent). Researchers found a association between their rating at the beginning of the semester (x) and their rating at the end of the semester (y). Res of a regression analysis are provided below. Use the analysis to find the equation of the regression line. Predictor Regression t statistic Coefficient value Constant 3.584756 45.85075 .005 (Intercept) Self-Rated Health 0.090953 4.103932 .003 at Beginning of Semester A) y = 3.584756x+ 0.090953 B) y = 45.85075+0.090953x C) y 3.584756+0.022162x D) y = 3.584756 0.022162x E) y = 3.584756+0.090953x

Functions and Change: A Modeling Approach to College Algebra (MindTap Course List)
6th Edition
ISBN:9781337111348
Author:Bruce Crauder, Benny Evans, Alan Noell
Publisher:Bruce Crauder, Benny Evans, Alan Noell
Chapter3: Straight Lines And Linear Functions
Section3.CR: Chapter Review Exercises
Problem 16CR: XYZ Corporation Stock Prices The following table shows the average stock price, in dollars, of XYZ...

Related questions
Question
Transcribed Image Text:Completion Status;
QUESTION 38
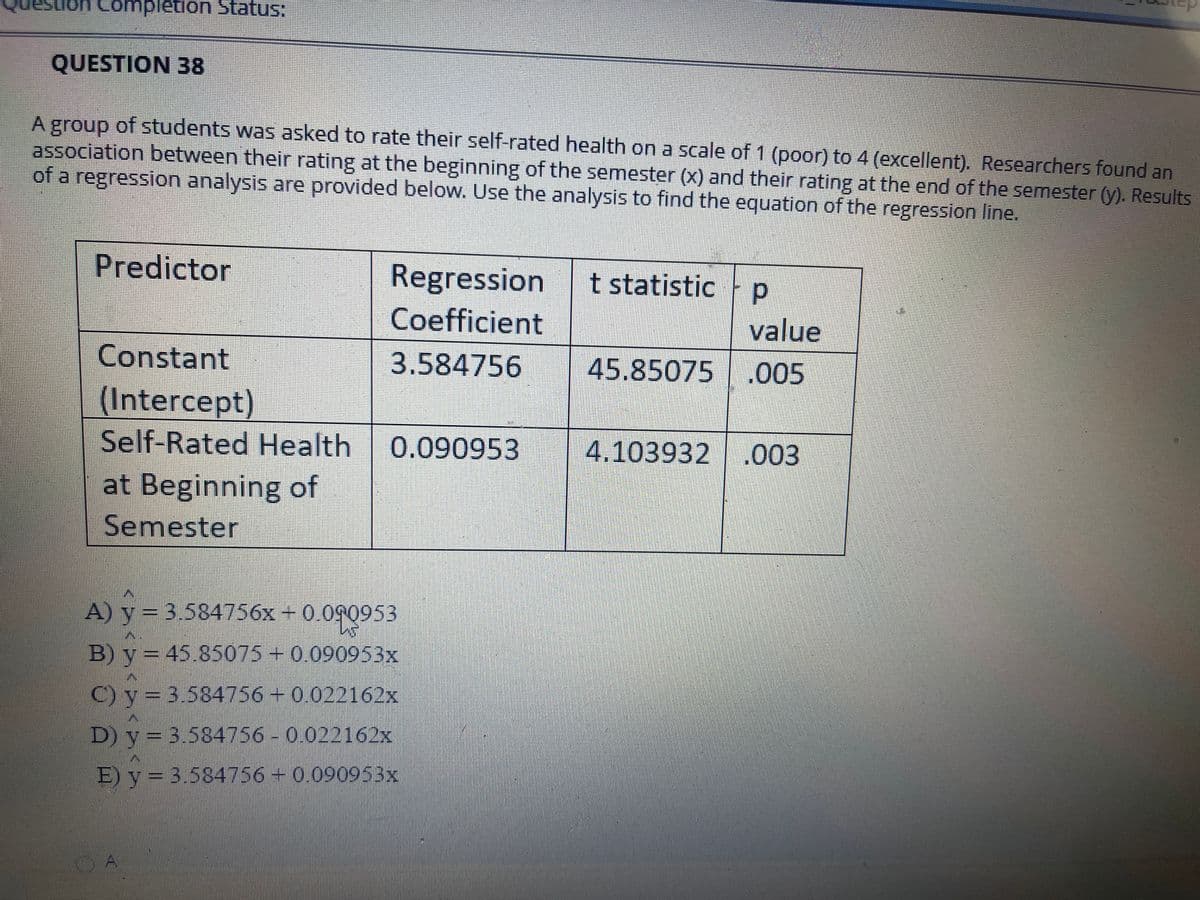
A group of students was asked to rate their self-rated health on a scale of 1 (poor) to 4 (excellent). Researchers found an
association between their rating at the beginning of the semester (x) and their rating at the end of the semester (y). Results
of a regression analysis are provided below. Use the analysis to find the equation of the regression line.
Predictor
Regression
t statistic p
Coefficient
value
45.85075 .005
Constant
3.584756
(Intercept)
Self-Rated Health
0.090953
4.103932.003
at Beginning of
Semester
A) y= 3.584756x+ 0.090953
B) y = 45.85075+ 0.090953x
C) y = 3.584756 +0.022162x
D) y = 3.584756-0.022162x
E) y = 3.584756+0.090953x
OA
Expert Solution
This question has been solved!
Explore an expertly crafted, step-by-step solution for a thorough understanding of key concepts.

Step by step
Solved in 2 steps

Recommended textbooks for you
Functions and Change: A Modeling Approach to Coll…
Algebra
ISBN:
9781337111348
Author:
Bruce Crauder, Benny Evans, Alan Noell
Publisher:
Cengage Learning

College Algebra
Algebra
ISBN:
9781305115545
Author:
James Stewart, Lothar Redlin, Saleem Watson
Publisher:
Cengage Learning

Algebra and Trigonometry (MindTap Course List)
Algebra
ISBN:
9781305071742
Author:
James Stewart, Lothar Redlin, Saleem Watson
Publisher:
Cengage Learning
Functions and Change: A Modeling Approach to Coll…
Algebra
ISBN:
9781337111348
Author:
Bruce Crauder, Benny Evans, Alan Noell
Publisher:
Cengage Learning
College Algebra
Algebra
ISBN:
9781305115545
Author:
James Stewart, Lothar Redlin, Saleem Watson
Publisher:
Cengage Learning
Algebra and Trigonometry (MindTap Course List)
Algebra
ISBN:
9781305071742
Author:
James Stewart, Lothar Redlin, Saleem Watson
Publisher:
Cengage Learning

Glencoe Algebra 1, Student Edition, 9780079039897…
Algebra
ISBN:
9780079039897
Author:
Carter
Publisher:
McGraw Hill