EXAMPLE 1. We have two sets of scores in a mathematics test given to grade 10 boys and girls. Here are the sets of scores with 100 as the highest possible score. 74 74 78 85 Вoys: 89 88 86 81 87 73 81 75 89 87 89 88 88 93 76 86 92 74 90 90 79 92 94 94 Girls: 72 78 75 78 75 90 76 72 92 85 76 71 86 75 96 71 74 76 87 74 80 81 75 74 71 76 71 71 Let us compare the two sets of scores of the boys and those of the girls by considering the statistical values, namely, the range, mean, and standard deviation. Boys Girls n, number of observation 28 28 range 94-73-21 96-71-25 x, mean of the distribution 84.71 77.79 S, standard deviation 6.84 6.90 Interpretation: The range of the scores of the boys is 21; the range of the scores of the girls is 25. There is a wider gap between the highest and lowest observations in the set of scores of the girls. A girl is the "top" scorer for this test, a 96. However, the lowest score of 71 for the test is found of the set of scores of the girls.28 girls who took the same test The mean, also called the average, of the 28 boys who took the math test is 84.71. This mean score is higher than 77.79, the mean of the 28 girls who took the same test. The mean difference in the scores in the test of the two groups is 6.92.
EXAMPLE 1. We have two sets of scores in a mathematics test given to grade 10 boys and girls. Here are the sets of scores with 100 as the highest possible score. 74 74 78 85 Вoys: 89 88 86 81 87 73 81 75 89 87 89 88 88 93 76 86 92 74 90 90 79 92 94 94 Girls: 72 78 75 78 75 90 76 72 92 85 76 71 86 75 96 71 74 76 87 74 80 81 75 74 71 76 71 71 Let us compare the two sets of scores of the boys and those of the girls by considering the statistical values, namely, the range, mean, and standard deviation. Boys Girls n, number of observation 28 28 range 94-73-21 96-71-25 x, mean of the distribution 84.71 77.79 S, standard deviation 6.84 6.90 Interpretation: The range of the scores of the boys is 21; the range of the scores of the girls is 25. There is a wider gap between the highest and lowest observations in the set of scores of the girls. A girl is the "top" scorer for this test, a 96. However, the lowest score of 71 for the test is found of the set of scores of the girls.28 girls who took the same test The mean, also called the average, of the 28 boys who took the math test is 84.71. This mean score is higher than 77.79, the mean of the 28 girls who took the same test. The mean difference in the scores in the test of the two groups is 6.92.

Glencoe Algebra 1, Student Edition, 9780079039897, 0079039898, 2018
18th Edition
ISBN:9780079039897
Author:Carter
Publisher:Carter
Chapter10: Statistics
Section10.1: Measures Of Center
Problem 14PPS

Related questions
Question
Compare the two sets of scorce using the range, mean, and standard deviation and interpret the results. See example 1.
Transcribed Image Text:EXAMPLE 1.
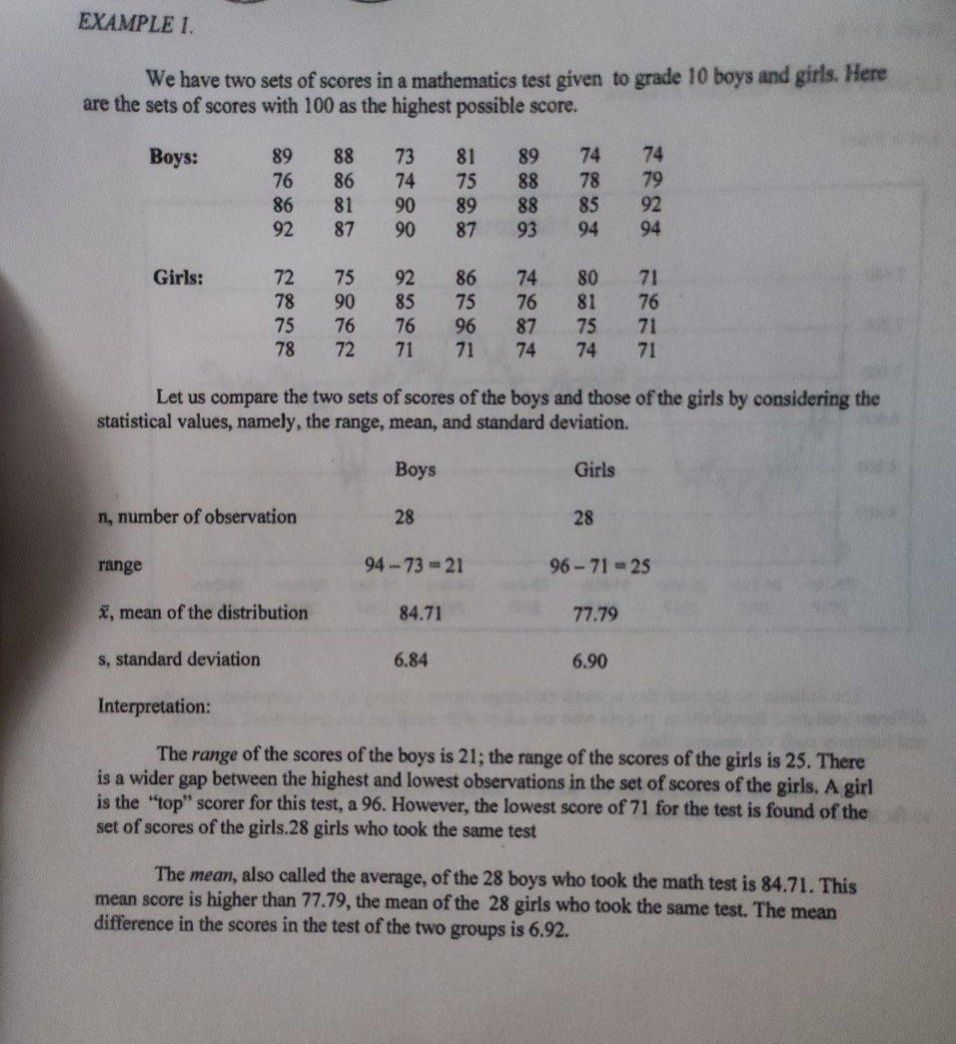
We have two sets of scores in a mathematics test given to grade 10 boys and girls. Here
are the sets of scores with 100 as the highest possible score.
74
79
92
Boys:
89
76
74
88
73
74
81
89
88
88
93
86
78
75
89
87
85
86
92
81
87
90
90
94
94
Girls:
72
78
75
78
75
92
85
71
86
75
96
71
74
76
87
74
80
81
90
76
76
76
71
75
74
71
71
72
Let us compare the two sets of scores of the boys and those of the girls by considering the
statistical values, namely, the range, mean, and standard deviation.
Вoys
Girls
n, number of observation
28
28
range
94-73-21
96-71 25
x, mean of the distribution
84.71
77.79
S, standard deviation
6.84
6.90
Interpretation:
The range of the scores of the boys is 21; the range of the scores of the girls is 25. There
is a wider gap between the highest and lowest observations in the set of scores of the girls, A girl
is the "top" scorer for this test, a 96. However, the lowest score of 71 for the test is found of the
set of scores of the girls.28 girls who took the same test
The mean, also called the average, of the 28 boys who took the math test is 84.71. This
mean score is higher than 77.79, the mean of the 28 girls who took the same test. The mean
difference in the scores in the test of the two groups is 6.92.
Expert Solution
This question has been solved!
Explore an expertly crafted, step-by-step solution for a thorough understanding of key concepts.

This is a popular solution!

Trending now
This is a popular solution!

Step by step
Solved in 4 steps

Recommended textbooks for you
Glencoe Algebra 1, Student Edition, 9780079039897…
Algebra
ISBN:
9780079039897
Author:
Carter
Publisher:
McGraw Hill

College Algebra (MindTap Course List)
Algebra
ISBN:
9781305652231
Author:
R. David Gustafson, Jeff Hughes
Publisher:
Cengage Learning

Holt Mcdougal Larson Pre-algebra: Student Edition…
Algebra
ISBN:
9780547587776
Author:
HOLT MCDOUGAL
Publisher:
HOLT MCDOUGAL
Glencoe Algebra 1, Student Edition, 9780079039897…
Algebra
ISBN:
9780079039897
Author:
Carter
Publisher:
McGraw Hill
College Algebra (MindTap Course List)
Algebra
ISBN:
9781305652231
Author:
R. David Gustafson, Jeff Hughes
Publisher:
Cengage Learning
Holt Mcdougal Larson Pre-algebra: Student Edition…
Algebra
ISBN:
9780547587776
Author:
HOLT MCDOUGAL
Publisher:
HOLT MCDOUGAL