Question 6 Calculate the standard deviation.
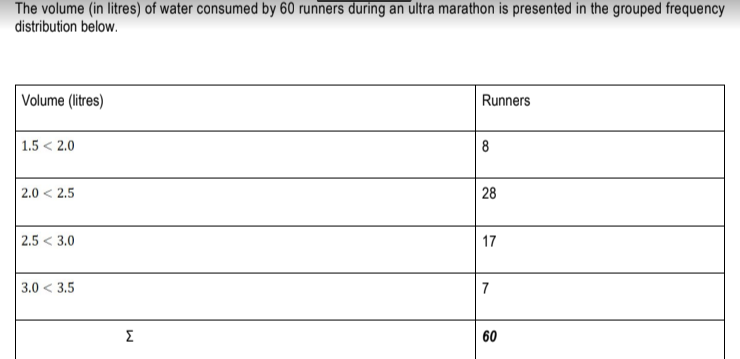
Q: X and Y are independent random variables with expected values and standard deviations as shown. X Y…
A: From the provided information, X and Y are independent random variables with expected values and…
Q: (c) Provide a 95 % CI (in ppm) for the difference in mean CO between the smoking and nonsmoking…
A: Let x1 denotes the smoking is permitted. And x2 denotes the smoking is not permitted. With the usual…
Q: IQ Scores How many students have a score of at least 94? What is the class size of the given table?…
A: Introduction The frequency denotes the no. of times an observation has occurred.
Q: In a recent survey, 10,000 households were randomly selected. One of the questions on the survey…
A: Given data is # of TVs # of Households P(X=x) 0 160 1 3140 2 3790 3 1920 4 780…
Q: Plot and describe the distribution of breakup dates, and provide appropriaate numerical summaries.…
A: Data is given for 1917 to 2017 Days : 11,22,14,22,23,20.....31,6,3,4,12 We have to creat…
Q: ote? enotes the complement of event A, meaning that A consists of all outcomes in which event A does…
A: We have given that, P(A) = 0.996 then we will fine P(Ā) = ?
Q: One thousand men who were working in factory X were screened for HIV on January 1st 2010 and 50 of…
A: Given that, The 50 men were found to be positive for HIV antibodies on January 1st 2010 The total…
Q: One of the reasons why the concept of an unfair coin is important in probability is that many…
A: given data P(x=k) = nCkpkqn-k _______binomial distributionn = 9P(late to work) = p = 0.31k = no. of…
Q: Age Group Number of Respondents18-25 6226-34 6035-44 5545-54 7055 - 75 53 identify the modal…
A: The question is about frequency distribution Given : To find : Modal interval and interpretation
Q: An instructor grades as follows: unit exams 20%, project 30%, and final exam 50%. A student had…
A:
Q: Mean 1 = 17, SD 1=7.89 Mean 2= 89, SD 2= 6.69 R = -0.84 What is the proportion of variance shared…
A: Obtain the value of the correlation. The value of the correlation is obtained below as follows: From…
Q: Check here for instructional material to complete this problem. Evaluate E=z 92=0.9985. * A A P₁ 91…
A: Given,Z*=1.645n1=2705n2=7866p^1=0.0118q^1=0.9882p^2=0.0015q^2=0.9985
Q: A population of values has a normal distribution with = 162.5 and o= 89.7. You intend to draw a…
A: Given,sample size(n)=231mean(μ)=162.5standard deviation(σ)=89.7
Q: A student measuring how gasoline prices change records the cost of gas at 10 randomly selected…
A: Introduction Data are the nos. that are collected and analyzed to draw meaningful insight from it.
Q: Suppose the population variance for a given population is 36. If we select all possible samples of a…
A: Given that Population variance=36
Q: Calculate the z scores for each variable (education and memory)
A: Z-score: The z-score is a statistical measurement. The relationship between a value and a set of…
Q: The sample means target the value of the population mean. true or false
A: Introduction: It is required to identify the statement as true or false.
Q: A survey of US adults ages 18-29 found that 93% use the Internet. You randomly select 100 adults…
A: Given that: Success probability, p=0.93 Sample size, n=100
Q: Consider the population consisting of {4,5,9}. If samples of size n = 2 are randomly selected from…
A: Here we have given the, population : 4,5,9 We have to select the sample of size 2 from thw…
Q: Compare the absolute difference between conditions (e.g. the mean was 2.5 words higher for condition…
A: The objective is to describe the given summary statistics of Control and Experimental groups.
Q: Check here for instructional material to complete this problem. A A P₁.1 P₂ ₂ + n₁ 7₂ Evaluate E=z…
A: given data,…
Q: Check here for instructional material to complete this problem. X1 A n₁ Evaluate the following…
A:
Q: A researcher believes that 9%9% of pet dogs in Europe are Labradors. If the researcher is right,…
A: The true proportion of dogs in Europe, which are defined as Labradors is 9%. The sample size, n=554.…
Q: You're a sociologist studying whether grocery prices are different in the inner cities than they are…
A: Given The data is as follows: SU IC 95.8 92.57 94.7 96.57 93.72 103.03 97.98 99.13…
Q: A particular brand of coffee contains the average of 110mg of caffeine per cup with a standard…
A:
Q: Consider the population consisting of {4,5,9}. If samples of size n = 2 are randomly selected from…
A: Given that The population consisting of {4,5,9}. If samples of size n = 2 are randomly selected from…
Q: A restaurant offers a $12 dinner special that has 4 choices for an appetizer, 10 choices for an…
A: Given: Choice of appetizer=4 Choice of entree=10 Choice of Desserts= 3 Number of different meals…
Q: (a) Compute E(XY). (b) Compute E(X).
A:
Q: Which if the following statistics is an unbiased estimator of its population parameter? Variance…
A: We know that ,the unbiased estimator is those value ,which are sample statistics of the population…
Q: There are 3 red balls and 2 blue balls in a bag. balls will be drawn without replacement. Find the…
A: GivenNo.of red balls=3No.of blue balls=2Total no.of balls=5
Q: the answer for question H? or is the output the answer for question H?
A: Temperature (oC) Corrosion (mm/yr.) 26.6 1.58 26 1.45 27.4 1.13 21.7 0.96 14.9 0.99 11.3…
Q: The distribution of sample variances tends to be a normal distribution. true or false?
A: To find: The distribution of sample variances tends to be a normal distribution. true or false?…
Q: (3.2 #16c) Most Expensive Colleges Listed below are the annual costs (dollars) of tuition and fees…
A: Given data: 57208, 55210, 54886, 54825, 54770, 54380, 54318, 54310, 54259, 54010
Q: Suppose that you are an elementary school teacher and you are evaluating the reading levels of your…
A: For the given distribution (which is distributed normally) of the reading speed (measured in words…
Q: (a) Describe the shape of the distribution.
A: Here given , Boxplot of literacy rate of countries of the world.
Q: A variable is normally distributed. The proportion of observations that are greater than a, is 3%.…
A: We have given that, The proportion of observation that are greater than a is 3%. Then,
Q: The following are a list of house prices for a neighborhood: $250,000, $275,000, $265,000, $245,000,…
A: Given The data is as follows: The list of house prices are as follows: $250,000, $275,000, $265,000,…
Q: Independent Sample T-Test: A researcher is interested in the anxiety levels of individuals who get…
A: x1 x2 In-Home (1) Out-of-Home (2) 1 8 5 6 1 7 3 7 4 7 3 5 3 5 1 4 4 6 6 5 5…
Q: You throw a six-sided dice five times. On average, how many times out of five do you expect to…
A: throw six sided dice five times. E(roll greater than three) = ?
Q: Consider a cone for which it is known that is 4 times more likely to land 'Sideways' than 'Upright'.…
A: Answer:- We know that, "the sum of the probabilities of all possible outcomes is 1". If we flip a…
Q: consider the set of families having two children. Assume that the four possible birth sequences…
A: Let b=boy g=girlif a family having two children than the possible outcomes ares={bb,bg,gb,gg}
Q: pdf 0.15 0.15 $4 $8 0.20 $15 0.40 $22 0.10 Tip amount Use the following information to answer…
A: Answer:- Here given information is - We know that, "the median is the value in the middle of a…
Q: The following stem-and-leaf chart gives the distance (in thousands of miles) driven during the past…
A: here stem and leaf plot is given we have to find out the range for the given data. data score are…
Q: 2. [modified from page 76 #3] Coughlin et al. examined the breast and cervical screening practices…
A: The question is about probability Given : To find : a ) randomly selected subject who had mammo.,…
Q: The following question involves a standard deck of 52 playing cards. In such a deck of cards there…
A: Given that a standard deck of 52 playing cards. In such a deck of cards there are four suits of 13…
Q: Which if the following statistics is an unbiased estimator of its population parameter? 1. Mean…
A: Answer:- We know that "Sample means, Sample Variances and Sample Proportions are unbiased estimators…
Q: An engineer wants to determine how the weight of a gas-powered car, x, affects gas mileage. v. The…
A: Note: "Since you have posted question with multiple subparts, we are answering first three subparts…
Q: Assume that a sample is used to estimate a population mean μ . Find the 90% confidence interval for…
A: Given,sample size(n)=62sample mean(x¯)=54.8standard deviation(s)=11.9degrees of…
Q: Assume that the number of days from conception to birth is normally distributed with a mean of 273…
A: Given data normal distributionμ = 273 daysσ = 5 daysP(x>301 days) = ?
Q: The following regression output was obtained from a study of architectural firms. The dependent…
A: Given information: The regression output was obtained from a study of architectural firms is given.
Step by step
Solved in 2 steps