Question 6 Where does discharge occur at the lowest part of the potentiometric surface? O Barton Springs O Blanco O Dripping Springs Jacob's well Question 7 Springs occur at several locations. Barton springs, San Marcos springs, Dripping Springs - but the elevation of the potentiometric surface is variable. What causes spring discharge occur at these locations? O Intersection of the potentiometric surface with the ground surface O Intersection of the potentiometric surface with an aquiclude O Intersection of the potentiometric surface with the recharge zone Question 8 TDS (total dissolved solids) is an indicator of the quality of the water in the aquifer. In the deepest part of the aquifer TDS gets so high from dissolving the surrounding limestone that it is undrinkable. The accumulation of TDS is thus generally a function of the residence time of the groundwater in the aquifer (the amount of time it has to accumulate the solids.) The red dashed curves on the map show TDS in this region. Why might the TDS differ from the potentiometric surface? (Select all that apply) O Because of variable bedrock properties Because of differences in human impacts on the quality of water recharging the aquifer Water quality and water quantity should always correspond, so there must be an error with the map OTDS should follow surface topography
Question 6 Where does discharge occur at the lowest part of the potentiometric surface? O Barton Springs O Blanco O Dripping Springs Jacob's well Question 7 Springs occur at several locations. Barton springs, San Marcos springs, Dripping Springs - but the elevation of the potentiometric surface is variable. What causes spring discharge occur at these locations? O Intersection of the potentiometric surface with the ground surface O Intersection of the potentiometric surface with an aquiclude O Intersection of the potentiometric surface with the recharge zone Question 8 TDS (total dissolved solids) is an indicator of the quality of the water in the aquifer. In the deepest part of the aquifer TDS gets so high from dissolving the surrounding limestone that it is undrinkable. The accumulation of TDS is thus generally a function of the residence time of the groundwater in the aquifer (the amount of time it has to accumulate the solids.) The red dashed curves on the map show TDS in this region. Why might the TDS differ from the potentiometric surface? (Select all that apply) O Because of variable bedrock properties Because of differences in human impacts on the quality of water recharging the aquifer Water quality and water quantity should always correspond, so there must be an error with the map OTDS should follow surface topography

Applications and Investigations in Earth Science (9th Edition)
9th Edition
ISBN:9780134746241
Author:Edward J. Tarbuck, Frederick K. Lutgens, Dennis G. Tasa
Publisher:Edward J. Tarbuck, Frederick K. Lutgens, Dennis G. Tasa
Chapter1: The Study Of Minerals
Section: Chapter Questions
Problem 1LR

Related questions
Question
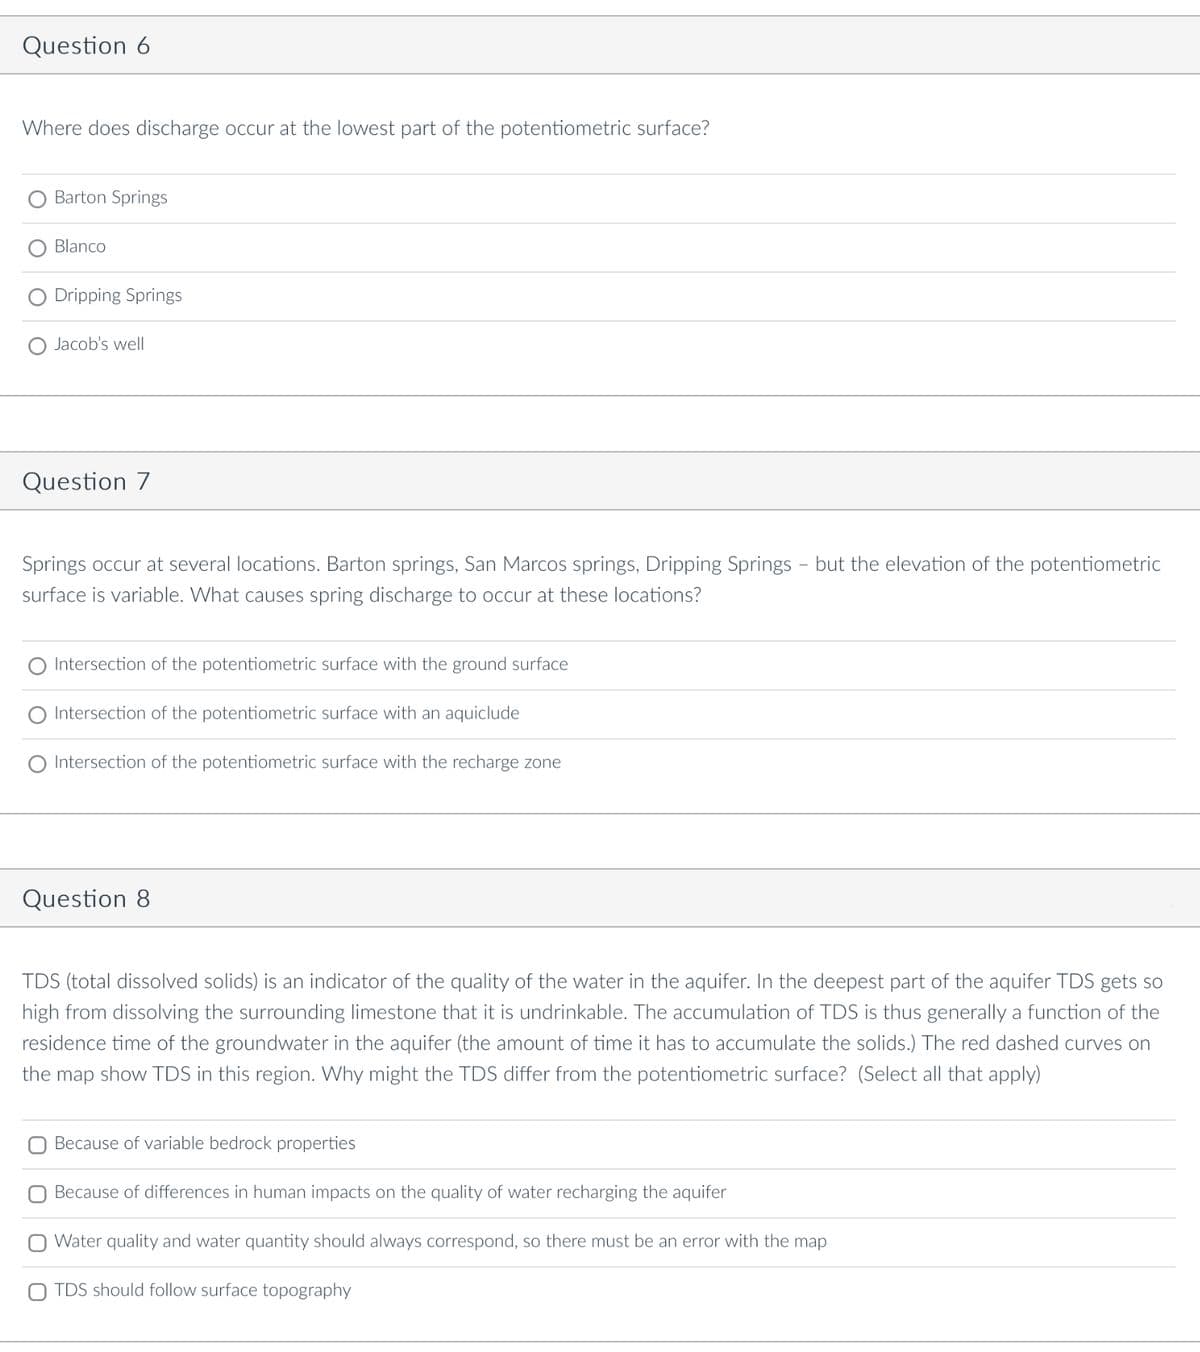
Transcribed Image Text:Question 6
Where does discharge occur at the lowest part of the potentiometric surface?
Barton Springs
Blanco
Dripping Springs
Jacob's well
Question 7
Springs occur at several locations. Barton springs, San Marcos springs, Dripping Springs - but the elevation of the potentiometric
surface is variable. What causes spring discharge to occur at these locations?
Intersection of the potentiometric surface with the ground surface
Intersection of the potentiometric surface with an aquiclude
Intersection of the potentiometric surface with the recharge zone
Question 8
TDS (total dissolved solids) is an indicator of the quality of the water in the aquifer. In the deepest part of the aquifer TDS gets so
high from dissolving the surrounding limestone that it is undrinkable. The accumulation of TDS is thus generally a function of the
residence time of the groundwater in the aquifer (the amount of time it has to accumulate the solids.) The red dashed curves on
the map show TDS in this region. Why might the TDS differ from the potentiometric surface? (Select all that apply)
Because of variable bedrock properties
Because of differences in human impacts on the quality of water recharging the aquifer
Water quality and water quantity should always correspond, so there must be an error with the map
TDS should follow surface topography
Transcribed Image Text:0
->N
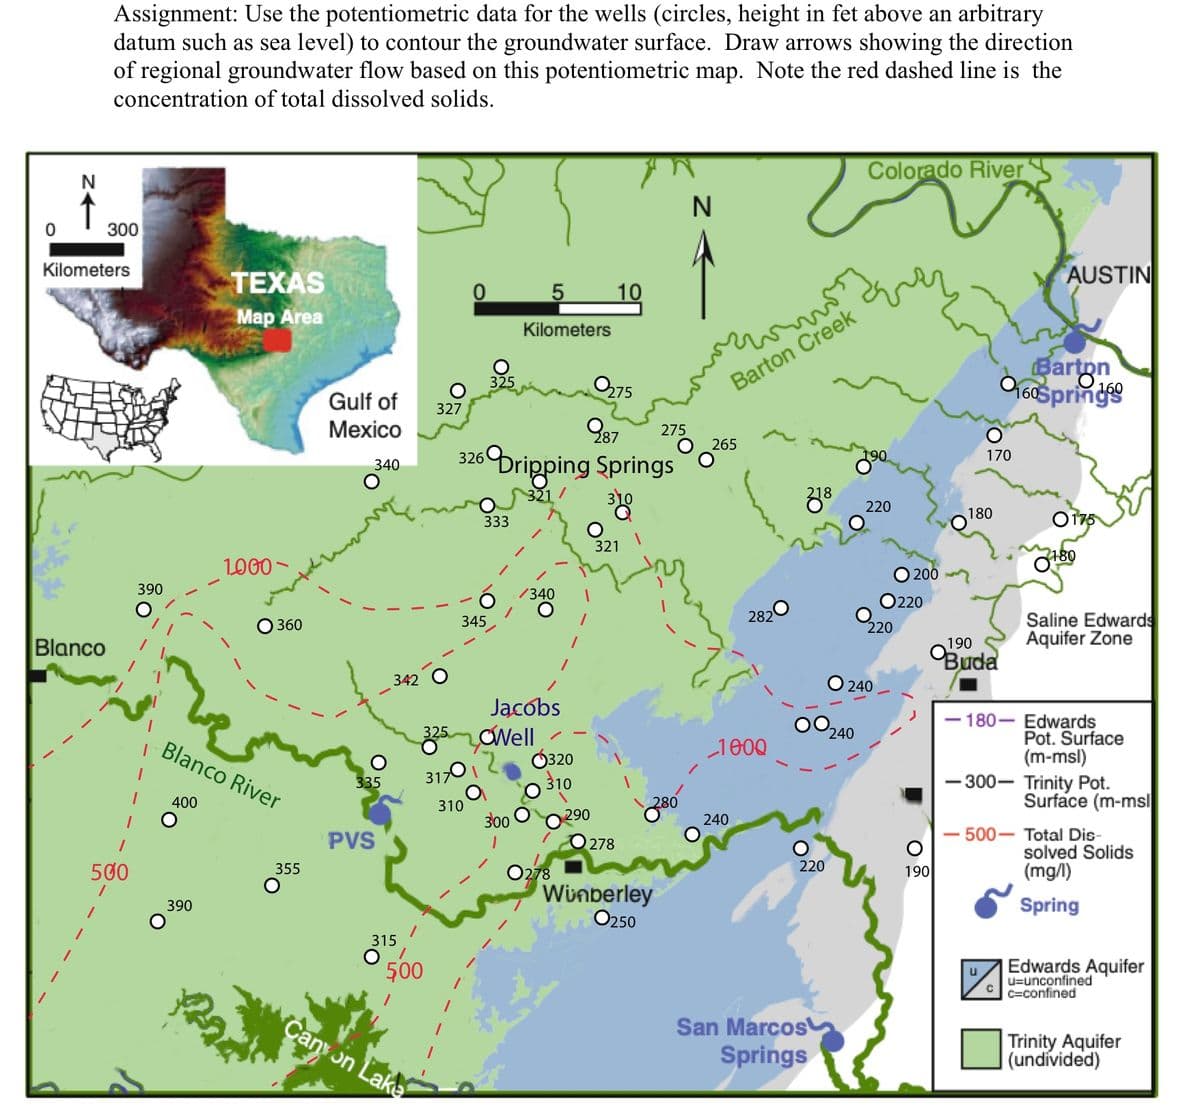
Assignment: Use the potentiometric data for the wells (circles, height in fet above an arbitrary
datum such as sea level) to contour the groundwater surface. Draw arrows showing the direction
of regional groundwater flow based on this potentiometric map. Note the red dashed line is the
concentration of total dissolved solids.
Blanco
300
Kilometers
500
390
1
TEXAS
Map Area
390
1000
360
Blanco River
400
355
Gulf of
Mexico
340
335
PVS
342
315
325
327
317
500
Canyon Lake
0
310
345
325
0275
987
326 Dripping Springs
321/
333
5
Kilometers
300
/340
Jacobs
Well
0320
310
0278
O
290
10
321
278
275
280
Winberley
O250
N
como
Barton Creek
265
282
1000
240
218
220
San Marcos
Springs
Colorado River
240
190
220
220
240
200
220
O
190
170
180
Barton
0160Springs
190
Buda
AUSTIN
-180-
2180
Saline Edwards
Aquifer Zone
Edwards
Pot. Surface
(m-msl)
-300- Trinity Pot.
Surface (m-msl
500- Total Dis-
solved Solids
(mg/l)
Spring
Edwards Aquifer
u-unconfined
Cc-confined
Trinity Aquifer
(undívided)
Expert Solution
This question has been solved!
Explore an expertly crafted, step-by-step solution for a thorough understanding of key concepts.

This is a popular solution!

Trending now
This is a popular solution!

Step by step
Solved in 2 steps

Recommended textbooks for you
Applications and Investigations in Earth Science …
Earth Science
ISBN:
9780134746241
Author:
Edward J. Tarbuck, Frederick K. Lutgens, Dennis G. Tasa
Publisher:
PEARSON

Exercises for Weather & Climate (9th Edition)
Earth Science
ISBN:
9780134041360
Author:
Greg Carbone
Publisher:
PEARSON

Environmental Science
Earth Science
ISBN:
9781260153125
Author:
William P Cunningham Prof., Mary Ann Cunningham Professor
Publisher:
McGraw-Hill Education
Applications and Investigations in Earth Science …
Earth Science
ISBN:
9780134746241
Author:
Edward J. Tarbuck, Frederick K. Lutgens, Dennis G. Tasa
Publisher:
PEARSON
Exercises for Weather & Climate (9th Edition)
Earth Science
ISBN:
9780134041360
Author:
Greg Carbone
Publisher:
PEARSON
Environmental Science
Earth Science
ISBN:
9781260153125
Author:
William P Cunningham Prof., Mary Ann Cunningham Professor
Publisher:
McGraw-Hill Education

Earth Science (15th Edition)
Earth Science
ISBN:
9780134543536
Author:
Edward J. Tarbuck, Frederick K. Lutgens, Dennis G. Tasa
Publisher:
PEARSON

Environmental Science (MindTap Course List)
Earth Science
ISBN:
9781337569613
Author:
G. Tyler Miller, Scott Spoolman
Publisher:
Cengage Learning

Physical Geology
Earth Science
ISBN:
9781259916823
Author:
Plummer, Charles C., CARLSON, Diane H., Hammersley, Lisa
Publisher:
Mcgraw-hill Education,