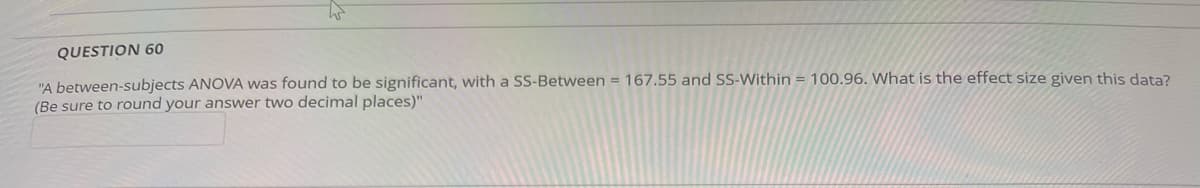
QUESTION 60 "A between-subjects ANOVA was found to be significant, with a SS-Between= 167.55 and SS-Within = 100.96. What is the effect size given this data? (Be sure to round your answer two decimal places)"


Q: For the following: normal random variable with parameters μ = 0,0² = 1/2. 1. Compute the moment…
A: Given a normal random variable with parameters μ=0, σ2=12.
Q: Median Weekly Earnings for Women with Some College or an Associate's Degree 1980 2013 $231 $657…
A: Given: Median weekly earnings for women in: 1980 is $231 2013 is $657 Mathematical model W = 13n +…
Q: QUESTION 18 "An repeated measures ANOVA is used to evaluate the differences among 4 treatment…
A:
Q: Chauncey Billups, a current shooting guard for the Los Angeles Clippers, has a career free-throw…
A: given data Chauncey Billups , acirrent shooting guard for the Los Angeles Cliipers,has a carrer…
Q: When the classical linear model assumptions are fulfilled, the OLS estimator is...…
A:
Q: 1. Wellstone Inc. produces and markets replacement covers for cell phones in a variety of colors.…
A: Hi! Thank you for the question, As per the honor code, we are allowed to answer three sub-parts of a…
Q: The table provides summary statistics on highway fuel economy of cars manufactured in 2012 (from…
A:
Q: nite. 83 Jaguar. 129 Jeep. 128 Kia. 135 Land Rover 175 Lexus. 107 Lincoln. 93 Mazda. 114…
A: Hint: A Stem and leaf plot displays numerical data by splitting each data point into a "leaf "…
Q: In a survey, 18 people were asked how much they spent on their child's last birthday gift. The…
A: Given: Sample size, n is 18 Sample mean, x¯=39 Sample standard deviation, s=18 Confidence level is…
Q: 3. Let Y be the sum of the four trait scores for a character chosen uniformly at random out of the…
A: Hint: Question just seems to be tricky but the answer is just simple as we need to know the basics…
Q: Last year's mean hourly wage (in dollars) for all hospital clerical workers in a large state was…
A: Given that Last year's mean hourly wage (in dollars) for all hospital clerical workers in a large…
Q: There are 7 streets to be named after 7 tree types. Ash, Elm, Fir, Maple, Oak, Pine, and Willow. A…
A: Given that Number of streets =7 Number of trees =7 Tree types Ash, Elm, Fir, Maple, Oak, Pine, and…
Q: For a fishing trip, Lashonda is going to choose lures to put in her tackle box. She has 7 lures that…
A: We have given that Lashonda has 7 lures that are crankbaits and 9 are jigs Here we will use the…
Q: Random samples of size 81 are taken from a process (an infinite populati 200 and 18, respectively.…
A: A sample size is 81; n=81 Mean and standard deviation of sample taken from infinite population is…
Q: a. Find the coefficient of correlation. b. Create a scatter diagram based on the data.
A: Given: Month Advertising Expense, X Sales revenue, Y April 10 180 May 14 170 June 12 190…
Q: Johnson Wholesale Company manufactures a variety of products. The prices and quantities produced for…
A: From the given information 2010 is the base period and 2019 is the current period. Let P0 be the…
Q: QUESTION 43 "Calculate the pooled variance for the following samples: Sample 1, n = 22 with a sample…
A: Formula : Pooled variance
Q: (a) State the null hypothesis Ho and the alternative hypothesis H₁. Ho :O (b) Determine the type of…
A: Given that n1 = 458 , X1 = 206 , n2 = 429 , X2 = 179 Note : According to bartleby experts question…
Q: During a week in September 2009, the Nielsen ratings for Family Guy were 8.1/12 which means 8.1 out…
A: Since you have asked multiple questions, we will solve the first question for you. If you want any…
Q: You are interested in finding a 95% confidence interval for the average commute that non-…
A: Given data is25,16,12,9,18,14,25,24,25,26,22,14,9sample size(n)=13confidence level=95%
Q: Analysis of variance compares the means of a response variable for several groups. ANOVA compares…
A:
Q: You are a researcher studying the lifespan of a certain species of bacteria. A preliminary sample of…
A: Given data n = 30 x¯ =76 S = 6.4 99% ci E = 0.55 n = ?
Q: A meteorologist is concerned about the number of tornadoes in her county. Using data from the past…
A: I solve this problem using Excel.
Q: A repeated measures ANOVA produced the partially completed ANOVA summary table below. Use this data…
A: The partial summary of repeated measure ANOVA table is given below.
Q: Four typists take 15,10,6 and 5 minutes respectively to type a letter. Determine the average time…
A: The time required to type a letter by four typists is given as: 15 minutes, 10 minutes, 6 minutes, 5…
Q: A newsgroup is interested in constructing a 99% confidence interval for the proportion of all…
A:
Q: What are the range, variance, and standard deviation of 0, 5, 10, 15, 20, and 25?
A: The following information has been given: 0, 5, 10, 15, 20, 25
Q: Correlation and regression are two closely related topics in statistics. For each of the following…
A: The objective is to define if correlation, regression, both correlation and regression, or none is…
Q: Hypothesis Test: Perform the specified hypothesis test. Be sure to include your statistical…
A: A sample of 40 customers and finds that average mileage of the cars serviced is 30,456 miles with…
Q: A manufacturer knows that their items have a normally distributed lifespan, with a mean of 13 years,…
A: Given Mean = 13 Sd = 2
Q: In a study entitled How Undergraduate Students Use Credit Cards, Sallie Mae reported that…
A: Given,sample size(n)=180sample mean(x¯)=$3,325population standard deviation(σ)=$1,000α=0.05
Q: 4. Find the interquartile range for the following data: 4, 5, 7, 5, 17, 5, 4, 12, 14, 12, 18, 5
A: Here we have to find out the interquartile range for given data interquartile range = Q3- Q1For…
Q: A population consists of value 3. 5. 7 and 9. Take all possible simple random samples of size 2…
A:
Q: On the midnight shift, the number of patients with head trauma in an emergency room has the…
A:
Q: Consider the following random sample of diameter measurements (in inches) of 17 softballs. 4.77,…
A: Given Data : N=17 4.77 4.78 4.68 4.75 4.76 4.69 4.81 4.76 4.69 4.87 4.87…
Q: The coefficient of variation (CV) measures the dispersion of the data relative to the sample mean.…
A: From the provided information, Sample mean (x̄) = 550 Sample variance (s2) = 6400
Q: Employers want to know which days of the week employees are absent in a five-day work week. M…
A: The given data is Day Observed Frequency Monday 8 Tuesday 20 Wednesday 18 Thursday 25…
Q: QUESTION 22 "If an ANOVA had 14 observations in each condition, calculate the value of SS-within…
A: We have given that T1 = 32.56, T2 = 35.05, T3 = 35.46N = 14 +14 + 14 = 42 (since 14 is for each…
Q: our claim results in the following alternative hypothesis: Ha : μ < 152, which you test at a…
A: given data ,hypothesis :H0: μ =152H1: μ <152α=0.001 critical value =?
Q: Find the mean, median, and mode for the following data set. Round your answers to one decimal place,…
A: Given data: 11, 24, 24, -13, 14
Q: ail ridership during the summer months in the North-East is believed to be closely related to the…
A: R square is the measure used to estimate the variation explained in the regression model. It is also…
Q: QUESTION 12 'In an analysis of variance, differences caused by treatment effects contribute to which…
A: In an analysis of variance ,differences caused by treatment effects contribute to the, Ans =both…
Q: calculate the mean squared between treatments value for a repeated measures ANOVA with 26…
A: Introduction: It is required to calculate the mean squared between treatments value in case of a…
Q: Find the mean, median, and mode. Round answers to 2 decimal places B) Are the mean and median about…
A: Given that The data are X 36 , 49 , 24 , 66 , 25 , 12 , 55 , 12 , 50 , 4 , 14 , 43 , 42 , 102 , 33…
Q: Nationally, patients who go to the emergency room wait an average of 4 hours to be admitted into the…
A:
Q: The following is a set of data for a population with N=10. 15 2 1 3 10 9 9 10 9 8 a. Compute the…
A: Given data set15,2,1,3,10,9,9,10,9,8 Sample size(N)=10
Q: In a recent study on world happiness, participants were asked to evaluate their current lives on a…
A: Concept: Z score= (X-mean)/standard deviation
Q: Suppose that a certain college class contains 49 students. Of these, 27 are sophomores, 26 are…
A: Let S be the event of getting sophomores E be the event of getting English major n(S)=27, n(E)=26,…
Q: Use the Student_Data which consists of 200 MBA students at Whatsamattu U. It includes variables…
A: Given data is entered in excel ID Gender Major Employ Age MBA_GPA BS GPA Hrs_Studying Works FT…
Q: 3. Let X certain production line. It is known that, for a given lot, X is a binomial random…
A: Given data Binomial distribution μ=240variance=48

Step by step
Solved in 2 steps

- Table 4.20 appeared in a national study of 15- and 16-year-old adolescents. The event of interest is ever having sexual intercourse. Analyze these data and summarize in a one-page report, including description and inference about the effects of both gender and race. Note: No need for a whole page, just need to include related information.question 26 a repeated measures ANOVA using 11 participants observed a df within = 30 and ss-error= 28.05. what will be the value of ms error given this information?Question 2 There is a claim that drink driving has been very common in high ways. The Highway Police randomly caught 300 drivers for breath alcohol test and found that 14% of drivers have breath alcohol over the legal limit. At 4% level of significance, use the p-value approach to test the hypothesis that the percentage of drivers who are drink driving is more than 10%.
- Is there a relationship between one’s gender and whether one owns a dog, cat, or reptile? Use the data provided in the table below to answer the following question. -Show all the relevant statistical output How do I enter this data in SPSS and which test do I run? I input one column for each level but I am so confused and my output is weird looking. Do I run the One Way ANOVA in order to be able to calculate the effect size? Dog Cat Reptile Row Totals Male 20 17 11 48 Female 25 23 5 53 Column totals 45 40 16 101question 6 help ) Katie and Bonnie decide to buy some Krispy Kernel microwave popcorn. They arecompletely bowled over by the high-tech graphics on the package, showing how thepopping times for a bag of this carefully produced product are normally distributedwith a mean of 3.0 minutes. (And yet, they know enough about statistics to beskeptical about untested claims about the value of a population mean.)Sampling the product themselves, they obtain the following popping times (inminutes) for their sample of 5 bags:3.9 2.8 3.4 4.1 3.3a) Determine the following values, if possible, from the information given. If notpossible, write "N/A". (5)= ________ μ = ________ σ= ________ s = ________ n = ________b) Find a 90% confidence interval for the true mean popping time for this product Is it reasonable to conclude that the mean popping time is 3.0 minutes asadvertised? Why or why not?Dr. Palmer found a small treatment effect. What can she do in improve her changes of finding a statistically significant result?
- Is the life satisfaction after exercise higher than life satisfaction before exercise? State the null and alternative hypotheses for this question. What is your conclusion? Give the statistics to support your claim, including the effect size.Question 15 - ANOVA 1 National bearings manufactures bearings at plants located in Portland Oregon, Houston Texas and Jacksonville, Florida. To measure employee knowledge of Total Quality Management (TQM), six employees were randomly selected at each plant and tested. The test scores of these employees are given in the attached data. Managers want to know if, on averge, knowledge of TQM is equal across the 3 plants. Test equality of mean scores at x=0.05.Table 2 on page 603 is based on paired-samples t tests, a technique that we do not cover in this course. However, based on the p-values listed in the second to last column of the table, state three measures that showed a statistically significant change over 24 months for mothers and children in the MST-BSF group. Indicate whether the change was an increase or a decrease, and whether the change was in the mother or the child.?
