Question 7: For any confidence level C, the value of the sample proportion will always be considered a plausible value for p. (а) True (b) False Question 8: The Normal approximation to the sampling distribution for a population proportion will be adequate for a study with a sample size of 25 and a proportion of 0.9. (а) True (b) False Question 9: The following statements are attempts to interpret the 95% confidence interval (0.157, 0.179) for the proportion of Canadian adults that own a cat. Select all of the statements that are correct interpretations. (a) 16.8% of Canadian adults own a cat. (b) The most likely proportion of Canadian adults that own a cat is 16.8% (c) We don't know the true proportion of Canadian adults that own a cat, but we know it's within the interval (0.157, 0.179). (d) There is a 95% chance that the true proportion of Canadian adults that own a cat is within the interval (0.157, 0.179). (e) With repeated sampling, a confidence interval of this level will contain the true proportion of Canadian adults that own a cat 95% of the time.
Question 7: For any confidence level C, the value of the sample proportion will always be considered a plausible value for p. (а) True (b) False Question 8: The Normal approximation to the sampling distribution for a population proportion will be adequate for a study with a sample size of 25 and a proportion of 0.9. (а) True (b) False Question 9: The following statements are attempts to interpret the 95% confidence interval (0.157, 0.179) for the proportion of Canadian adults that own a cat. Select all of the statements that are correct interpretations. (a) 16.8% of Canadian adults own a cat. (b) The most likely proportion of Canadian adults that own a cat is 16.8% (c) We don't know the true proportion of Canadian adults that own a cat, but we know it's within the interval (0.157, 0.179). (d) There is a 95% chance that the true proportion of Canadian adults that own a cat is within the interval (0.157, 0.179). (e) With repeated sampling, a confidence interval of this level will contain the true proportion of Canadian adults that own a cat 95% of the time.

Chapter9: Sequences, Probability And Counting Theory
Section9.7: Probability
Problem 1SE: What term is used to express the likelihood of an event occurring? Are there restrictions on its...

Related questions
Question
Solved Correction for this questions please
7,8,9,
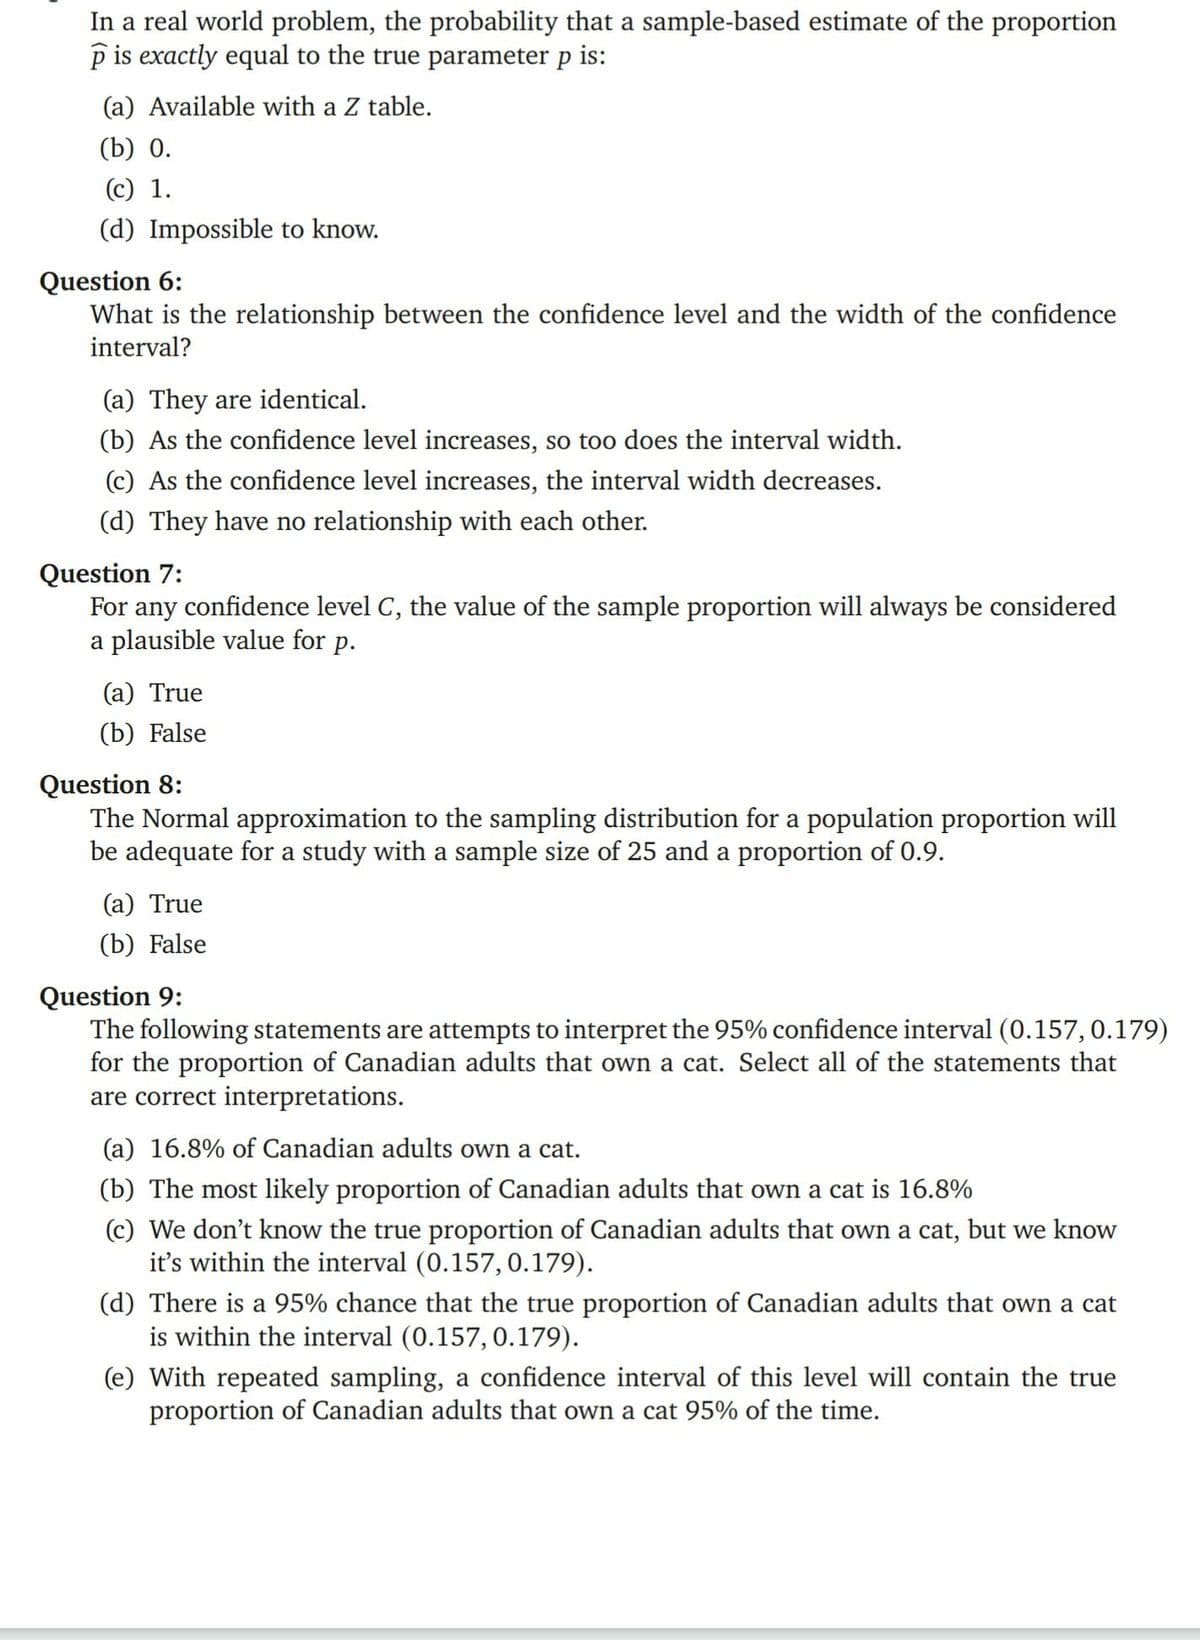
Transcribed Image Text:In a real world problem, the probability that a sample-based estimate of the proportion
p is exactly equal to the true parameter p is:
(a) Available with a Z table.
(b) 0.
(c) 1.
(d) Impossible to know.
Question 6:
What is the relationship between the confidence level and the width of the confidence
interval?
(a) They are identical.
(b) As the confidence level increases, so too does the interval width.
(c) As the confidence level increases, the interval width decreases.
(d) They have no relationship with each other.
Question 7:
For any confidence level C, the value of the sample proportion will always be considered
a plausible value for p.
(а) True
(b) False
Question 8:
The Normal approximation to the sampling distribution for a population proportion will
be adequate for a study with a sample size of 25 and a proportion of 0.9.
(a) True
(b) False
Question 9:
The following statements are attempts to interpret the 95% confidence interval (0.157,0.179)
for the proportion of Canadian adults that own a cat. Select all of the statements that
are correct interpretations.
(a) 16.8% of Canadian adults own a cat.
(b) The most likely proportion of Canadian adults that own a cat is 16.8%
(c) We don't know the true proportion of Canadian adults that own a cat, but we know
it's within the interval (0.157, 0.179).
(d) There is a 95% chance that the true proportion of Canadian adults that own a cat
is within the interval (0.157, 0.179).
(e) With repeated sampling, a confidence interval of this level will contain the true
proportion of Canadian adults that own a cat 95% of the time.
Expert Solution
This question has been solved!
Explore an expertly crafted, step-by-step solution for a thorough understanding of key concepts.

This is a popular solution!

Trending now
This is a popular solution!

Step by step
Solved in 3 steps

Knowledge Booster


Learn more about
Need a deep-dive on the concept behind this application? Look no further. Learn more about this topic, probability and related others by exploring similar questions and additional content below.Recommended textbooks for you