Question: Based on the above results, the researcher tested the hypotheses: Ho: B1=0 versus B1 not equal to 0, versus using T test. What do we know about the test statistic of the test? Based on the approximate p-value, what's the conclusion?


Q: 2. The Assignment 1 marks for several groups have come in and the group sizes, means and standard…
A: The data on group size, group means, and group standard deviation is given as follows Group no.(i)…
Q: You wish to test the following claim (H) at a significance level of a = 0.10. H : μ = 56.7 Ha: μ <…
A: We have given that,Sample mean: Sample size: Population mean: Population standard deviation:…
Q: Farmer Joe has another idea. His plants have been growing really well while using water, but maybe…
A: Farmer joe conduting an experiment to compair the yield of tamato plants watered with gatorade to…
Q: Apartment cost. The average cost of an apartment in the Cedar Lakes development is $62,000 USD with…
A: Average cost of an apartment μ(μ) in Cedar Lakes: $62,000 USDStandard deviation σ(σ) of apartment…
Q: A soccer team estimates that they will score on 7% of the comer kicks. If this team has 203 corner…
A: From the provided information,
Q: If your claim is in the alternative hypothesis and you fail to reject the null hypothesis, then your…
A: Solution:-When conducting a hypothesis test, we collect data and perform statistical analysis to…
Q: Consider the following estimated regression model relating annual salary to years of education and…
A: The regression equation to predict the estimated annual salary of an employee based on their number…
Q: You wish to test the following claim (H) at a significance level of a = 0.005. Ho : μ = 73.2 Ha : μ…
A: From the provided information,
Q: Find the value of z� such that the area between −z and z is 0.60−
A: Given thatP(-z<Z<z)=0.60.Here, we need to find the value of z.Formula:If Z is a standard…
Q: 14. Solve the following problems. a. A repeated-measures study with a sample of n = 8 participants…
A: Given sample size n=8Mean difference Md=3variance s2=72level of significance
Q: Ho: μ>= 170 n = 16 xbar = 165 H₂: S = 10 significance level = 0.10 crit = _stat = a = pvalue = tail
A: The population mean is μ.
Q: Cable TV choices: A telecommunications company provided its cable TV subscribers with free access to…
A: sample size(n)=404x=35significance level()=0.10sample proportion()=
Q: A group of researchers have decided to conduct a study to see if this screening test truly has the…
A: Given the table is, Disease statusNegative Positive TotalsNegative751287Test…
Q: 90% and 95% confidence intervals for the population proportion. Interpret the results and compare…
A: Answer Favorable cases [x] = 1230The sample size [n] = 2105
Q: Two possible p-values are given for a test. Which one provides the strongest evidence against H O…
A: Two possible are given for the testp value=0.200p value=0.07The Smaller p-value indicates the…
Q: 6. A university wants to promote the graduates of its honors program. At present it is stated that…
A:
Q: Find the critical value z a/2 needed to construct a confidence interval with level 92%. Round the…
A: From the provided information,Confidence level = 92%Level of significance
Q: According to the central limit theorem (CLT), no matter which distribution the data is collected…
A: The central limit theorem is used in what conditions.The central limit theorem states that "The…
Q: Using the Basic Limit Theorem verify that the MC below is irreducible & a periodic and find its…
A: Given the transition probability matrix P with state space, S= { 1,2,3,4}…
Q: Statistics 1. Ho: μ = 50 Hypothesis Testing One Sample H₂: o=5 n = 36 xbar = 49 significance level =…
A: “Since you have posted multiple questions, we will provide the solution only to the first question…
Q: For what values of p would you believe the claim made by the prep program?
A: It is required to find the values of the sample proportion, p̂, that would make the claim made by…
Q: You have been tasked with examining the queueing system of a continuously operating ride at a theme…
A: The given data is as follows:The arrival rate is .The average ride time .
Q: Construct a box-and-whisker plot for the data with a minimum of 12, first quartile of 15.5, median…
A: The information is given in terms of five number summary as follows:minimum=12; first…
Q: What is the smallest sample size that guarantees that the margin of error is less than 5% when…
A:
Q: Accounting procedures allow a business to evaluate its inventory costs based on two methods: LIFO…
A: The data is given as follows.FIFOLIFO225216123105101116212202253250wants to calculate the value of…
Q: Major League Baseball's World Series is a maximum of seven games, with the winner being the first…
A: Let "AT" denote the team Atlanta Braves and "MT" denote the Minnesota Twins.The maximum number of…
Q: The regulation of electric and gas utilities is an important public policy question affecting…
A: Given,the dendrogram of the hierarchical clustering of energy companies.To,find the first two…
Q: Mugs are packed into padded crates for shipping. Each crate contains 15 mugs. The mugs are normally…
A: Mugs are packed into padded crates for shipping. Each of the crate contain 15 mug each. The mugs are…
Q: What unit of analysis is needed with the Level of measurement for nominal and ratio.
A: The unit of analysis refers to the entity that is being studied.
Q: Suppose you have 5 red cards, 8 green cards, and 12 blue cards. The cards are well shuffled and you…
A: No. of red cards=5No. of green cards=8No. of blue cards=12Total no. of cards=5+8+12=25
Q: Salaries of a city follows a normal distribution with average salary of $1 million. Assume that…
A: sample size(n)=60Mean()=1standard deviation()=0.1
Q: Use the normal distribution and the given sample results to complete the test of the given…
A: Given,Hypotheses are-H0 : p = 0.3 vs Ha : p < 0.3n = 199Level of significance, α = 5% = 0.05
Q: Correct! Correct Answers A regional commuter airline selected a random sample of 25 flights and…
A: want to calculate the test statisticThe test statistic is given by,
Q: A population has a mean μ=169 and a standard deviation σ=21. Find the mean and standard deviation…
A: Mean()=169standard deviation()=21sample size(n)=46
Q: The director of research and development is testing a new medicine. The director claims that the…
A: The objective of this question is to determine whether there is sufficient evidence to support the…
Q: K1 IS GIVEN AS 0.59, FROM TABLE OF JOINT PMF ATTACHED TO THIS QUESTION, SOLVE THE FOLLOWING FOR…
A: The given joint probability mass function is as…
Q: In a factory, packs of sweets are supposed to contain 1kg each. In reality, the weights are normally…
A: Let X be the weight following normal distribution .
Q: The sugar content of the syrup in canned peaches is assumed normally distributed. A random sample is…
A: The provided information is as follows:The level of confidence is .The sample size is .The margin of…
Q: Match each step on the left with the procedure at that step on the right. Step 1 Todo a calculato…
A: The steps on the left-hand side match with the procedure on the right-hand side.
Q: 1213.98 (Experience) Suppose an employee with 14 years of education has been with the company for 8…
A: It is given that Estimated Salary = 10950.20 + 2769.6(Education) + 1213.98(Experience)
Q: Past studies have indicated that the percentage of smokers was estimated to be about 34%. Given the…
A: Given,Past studies have indicated that the percentage of smokers was estimated to be about 34%. That…
Q: x is a gaussian random variable with a PDF as described above, where μ is the mean, σ is the…
A: Given that X is a Gaussian random variable with μ is the mean, σ is the standard deviationFx(-4.8) =…
Q: According to a certain website, wine critics generally use a wine-scoring scale to communicate their…
A: Mean:The mean is the mathematical average of a set of two or more numbersFormula:mean = (sum of…
Q: In September 2011, Gallup surveyed 1,004 American adults and asked them whether they blamed Barack…
A: (1)Given that,
Q: Consider the following estimated regression model relating annual salary to years of education and…
A: Given that,The estimated regression model relating annual salary to years of education and work…
Q: Police sometimes measure shoe prints at crime scenes so that they can learn something about…
A: We have data as, Shoe PrintHeight29.6180.729.6182.730.5189.930.7168.627.4176.3The correlation value…
Q: er of errors per 1000 words made by a particular typist has a Poisson distribution with a mean of…
A:
Q: A research group conducted an extensive survey of 3116 wage and salaried workers on issues ranging…
A:
Q: The authors of a paper compared two different methods for measuring body fat percentage. One method…
A: There are two dependent samples which are X-ray and Ultrasound.We have to test whether the mean body…
Q: A sample of 100 individuals showed that 20% experienced gastrointestinal problems after consuming 10…
A: Given information:n = 100 sample size
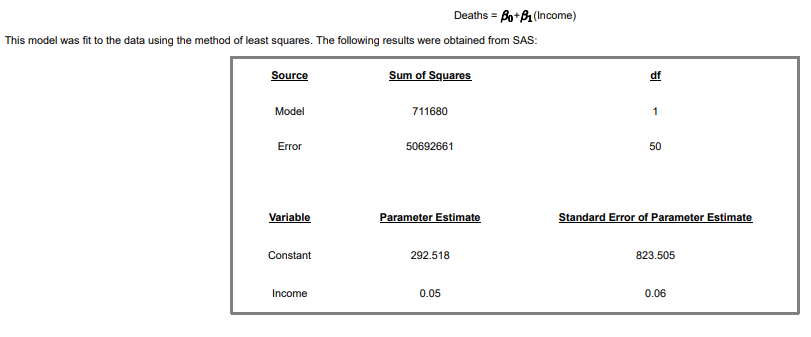
Please help me understand this problem more in depth. A researcher is investigating possible explanations for deaths in traffic accidents. He examined data from 2000 for each of the 52 cities randomly selected in the US. The data included information on the following variables: Deaths: The number of deaths in traffic accidents per city Income: The median income per city As part of his study, he ran the following simple linear regression model attached in photo.
Question: Based on the above results, the researcher tested the hypotheses: Ho: B1=0 versus B1 not equal to 0, versus using T test. What do we know about the test statistic of the test? Based on the approximate p-value, what's the conclusion?


Trending now
This is a popular solution!

Step by step
Solved in 4 steps with 5 images

- A random sample of 65 high school seniors was selected from all high school seniors at a certain high school. The following scatterplot shows the height, in centimeters (cm), and the foot length, in cm, for each high school senior from the sample. The least-squares regression line is shown. The computer output from the least-squares regression analysis is also shown. Term Coef (SE) Coef T-Value P-Value Constant 105.08 6.00 17.51 0.000 Foot length 2.599 0.238 10.92 0.000 S=5.90181 R–sq=65.42% (a) Calculate and interpret the residual for the high school senior with a foot length of 20cm and a height of 160cm. (b) The standard deviation of the residuals is s=5.9. Interpret the value in context. (c) The following histogram summarizes the 65 residuals. Assume that the distribution of residuals is approximately normal with mean 0cm and standard deviation 5.9cm. What percent of the residuals are greater than 8cm? Justify your answer.…A random sample of 65 high school seniors was selected from all high school seniors at a certain high school. The following scatterplot shows the height, in centimeters (cm), and the foot length, in cm, for each high school senior from the sample. The least-squares regression line is shown. The computer output from the least-squares regression analysis is also shown. Term Coef (SE) Coef T-Value P-Value Constant 105.08 6.00 17.51 0.000 Foot length 2.599 0.238 10.92 0.000 S=5.90181 R–sq=65.42% (a) The following histogram summarizes the 65 residuals. Assume that the distribution of residuals is approximately normal with mean 0cm and standard deviation 5.9cm. What percent of the residuals are greater than 8cm? Justify your answer. (b) Based on your answer to part (a), would it be surprising to randomly select a high school senior from the high school with a foot length of 20cm and a height greater than 165cm? Justify your answer.A random sample of 65 high school seniors was selected from all high school seniors at a certain high school. The following scatterplot shows the height, in centimeters (cm), and the foot length, in cm, for each high school senior from the sample. The least-squares regression line is shown. The computer output from the least-squares regression analysis is also shown. Term Coef (SE)Coef T-Value P-Value Constant 105.08 6.00 17.51 0.000 Foot length 2.599 0.238 10.92 0.000 S=5.90181 R–sq=65.42% (a) Calculate and interpret the residual for the high school senior with a foot length of 20cm and a height of 160cm.
- A random sample of 65 high school seniors was selected from all high school seniors at a certain high school. The following scatterplot shows the height, in centimeters (cm), and the foot length, in cm, for each high school senior from the sample. The least-squares regression line is shown. The computer output from the least-squares regression analysis is also shown. Term Coef (SE) Coef T-value P-value Constant 105.08 6.00 17.51 0.000 Foot Length 2.599 0.238 10.92 0.000 S=5.90181 R-sq= 65.42% (a) Calculate and interpret the residual for the high school senior with a foot length of 20cm and a height of 160cm. (b) The standard deviation of the residuals is s=5.9. Interpret the value in context. (c) The following histogram summarizes the 65 residuals. Assume that the distribution of residuals is approximately normal with mean 0cm and standard deviation5.9cm. What percent of the residuals are greater than 8cm? Justify your answer. (d) Based on your answer to part (c), would…A random sample of 65 high school seniors was selected from all high school seniors at a certain high school. The following scatterplot shows the height, in centimeters (cm), and the foot length, in cm, for each high school senior from the sample. The least-squares regression line is shown. The computer output from the least-squares regression analysis is also shown. Term Coef(SE) CoefT-ValueP-Value Constant 105.086.0017.510.000 Foot length 2.5990.23810.920.000 S=5.90181R–sq=65.42% (a) Calculate and interpret the residual for the high school senior with a foot length of 20cm and a height of 160cm. BoldItalicUnderlineSuperscriptSubscriptUndoRedoΩBullet listNumbered listImage (12 image limit) Edit imageView imageDelete image Question 2 (b) The standard deviation of the residuals is s=5.9. Interpret the value in context. BoldItalicUnderlineSuperscriptSubscriptUndoRedoΩBullet listNumbered listImage (12 image limit) Edit imageView imageDelete…Riboflavin (Vitamin B2) is determined in a cereal sample by measuring its fluorescence intensity(형광세기) in 5% acetic acid solution. A calibration curve was prepared by measuring the fluorescence intensities of a series of standards of increasing concentrations. The following data were obtained. Riboflavin (μg/mL) 0.000 0.100 0.200 0.400 0.800 Unknown sample Fluorescence intensity 0.0 5.8 12.2 22.3 43.3 15.4 (a) Use the method of least squares to obtain the best straight line through these five points (n=5). (b) Make a graph showing the experimental data and the calculated straight line. (c) An unknown sample gave an observed fluorescence intensity of 15.4. Calculate the concentration of Riboflavin (Vitamin B2) in the unknown sample (μg/mL). (d) Calculate the coefficient of determination (R2).
- An electric utility wishes to examine the relationship between temperature and electricity use in its service region during the summer months. The bivariate data below give the maximum temperature (denoted by x, in degrees Fahrenheit) and the electricity use (denoted by y, in thousands of kilowatt hours) for a random sample of fifteen summer days. The data are shown in the Figure 1 scatter plot. The least-squares regression line for these data has a slope of approximately 2.67. Answer the following. Carry your intermediate computations to at least four decimal places, and round your answers as specified below. (If necessary, consult a list of formulas.) What is the value of the y-intercept of the least-squares regression line for these data? Round your answer to at least two decimal places. What is the value of the sample correlation coefficient for these data? Round your answer to at least three decimal places.For a sample of 15 rural counties in one state, a researcher has collected information about the rate of deaths due to traffic accidents per 1,000,000 population and the percentage of the population which consists of males, age 16 to 25. For these variables, find the least squares regression line and compute r and r squared. Write a sentence or two summarizing and explaining your results. RATE OF % OF POPULATION County Traffic Deaths Young Males County Traffic Deaths Young Males A 15 4 B 16 5 C 22 10 D 23 9 E 20 8 F 25 11 G 18 2 H 15 6 I 19 12 J 10 3 K 9 2 L 18 15 M 15 9 N 24 16 O 9 3Two specimens of cold rolled steel sheet, which have differentcopper contents and annealing temperature are measured in hardness with the following results: First column = HardnessSecond column = Copper contentThird column = Annealing temperature a) Create a scatter plot to verify that it is reasonable to assume that the regression of Y on x is linear. b) Fit a straight line using the method of least squares. c) Fit an equation of the form (image 2), where x1 represents the copper content, x2 represents the annealing temperature, and y represents the hardness.
- Advertising share x and market share y fir a particular brand of cigarettes were sampled at ten randomly selected year. Summary information is: n = 10, Ex = .688, Ex2 = .050072, Ey =.835, Ey2 = 0.079491, Exy = .060861 a) Compute the least squares regression line b) Find the coefficient of determination r2 and explain what it means in the context of this problem. c) Compute a 90% prediction interval for market share when advertising share is .07(7%)An agent for a residential real estate company in a large city would like to be able to predict the monthly rental cost for apartments, based on the size of an apartment, as defined by square footage. The agent selects a sample of 25 apartments in a particular residential neighborhood and gathers the following data a. Construct a scatter plot. b. Use the least-squares method to determine the regression coefficients b0 and b1 c. Interpret the meaning of and in this problem. d. Predict the monthly rent for an apartment that has 1,000 square feet
