Question Help A doctor wants to estimate the mean HDL cholesterol of all 20- to 29-year-old females. How many subjects are needed to estimate the mean HDL cholesterol within 4 points with 99% confidence assuming s= 13.9 based on earlier studies? Suppose the doctor would be content with 90% confidence. How does the decrease in confidence affect the sample size required? E Click the icon to view a partial table of critical values A 99% confidence level requires subjects. (Round up to the nearest subject) A 90% confidence level requires subjects. (Round up to the nearest subject) How does the decrease in confidence affect the sample size required? O A. Decreasing the confidence level decreases the sample size needed. O B. Decreasing the confidence level increases the sample size needed. O C. The sample size is the same for all levels of confidence.
Question Help A doctor wants to estimate the mean HDL cholesterol of all 20- to 29-year-old females. How many subjects are needed to estimate the mean HDL cholesterol within 4 points with 99% confidence assuming s= 13.9 based on earlier studies? Suppose the doctor would be content with 90% confidence. How does the decrease in confidence affect the sample size required? E Click the icon to view a partial table of critical values A 99% confidence level requires subjects. (Round up to the nearest subject) A 90% confidence level requires subjects. (Round up to the nearest subject) How does the decrease in confidence affect the sample size required? O A. Decreasing the confidence level decreases the sample size needed. O B. Decreasing the confidence level increases the sample size needed. O C. The sample size is the same for all levels of confidence.

Glencoe Algebra 1, Student Edition, 9780079039897, 0079039898, 2018
18th Edition
ISBN:9780079039897
Author:Carter
Publisher:Carter
Chapter10: Statistics
Section10.3: Measures Of Spread
Problem 14PPS

Related questions

Concept explainers
Contingency Table
A contingency table can be defined as the visual representation of the relationship between two or more categorical variables that can be evaluated and registered. It is a categorical version of the scatterplot, which is used to investigate the linear relationship between two variables. A contingency table is indeed a type of frequency distribution table that displays two variables at the same time.
Binomial Distribution
Binomial is an algebraic expression of the sum or the difference of two terms. Before knowing about binomial distribution, we must know about the binomial theorem.
Topic Video
Question
2
Transcribed Image Text:Question Help
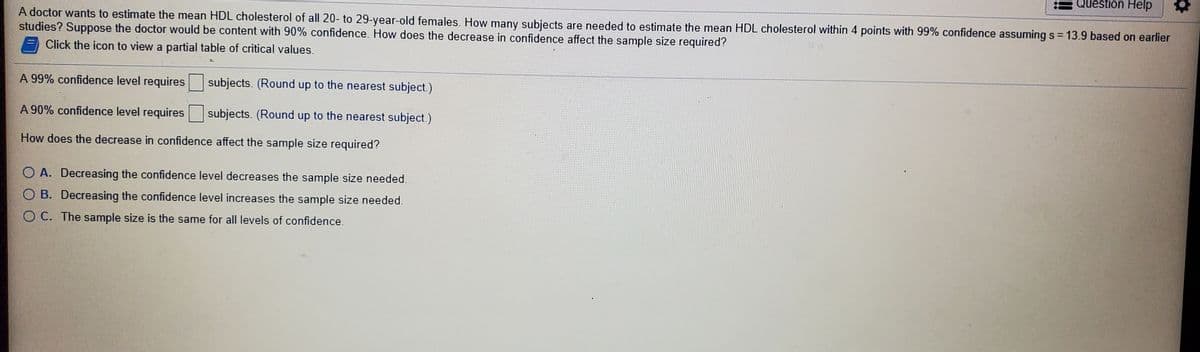
A doctor wants to estimate the mean HDL cholesterol of all 20- to 29-year-old females. How many subjects are needed to estimate the mean HDL cholesterol within 4 points with 99% confidence assuming s = 13.9 based on earlier
studies? Suppose the doctor would be content with 90% confidence. How does the decrease in confidence affect the sample size required?
%3D
Click the icon to view a partial table of critical values.
A 99% confidence level requires
subjects. (Round up to the nearest subject.)
A 90% confidence level requires subjects. (Round up to the nearest subject.)
How does the decrease in confidence affect the sample size required?
O A. Decreasing the confidence level decreases the sample size needed.
O B. Decreasing the confidence level increases the sample size needed.
O C. The sample size is the same for all levels of confidence.
Expert Solution
This question has been solved!
Explore an expertly crafted, step-by-step solution for a thorough understanding of key concepts.

This is a popular solution!

Trending now
This is a popular solution!

Step by step
Solved in 4 steps with 10 images

Knowledge Booster


Learn more about
Need a deep-dive on the concept behind this application? Look no further. Learn more about this topic, statistics and related others by exploring similar questions and additional content below.Recommended textbooks for you
Glencoe Algebra 1, Student Edition, 9780079039897…
Algebra
ISBN:
9780079039897
Author:
Carter
Publisher:
McGraw Hill

Big Ideas Math A Bridge To Success Algebra 1: Stu…
Algebra
ISBN:
9781680331141
Author:
HOUGHTON MIFFLIN HARCOURT
Publisher:
Houghton Mifflin Harcourt
Glencoe Algebra 1, Student Edition, 9780079039897…
Algebra
ISBN:
9780079039897
Author:
Carter
Publisher:
McGraw Hill
Big Ideas Math A Bridge To Success Algebra 1: Stu…
Algebra
ISBN:
9781680331141
Author:
HOUGHTON MIFFLIN HARCOURT
Publisher:
Houghton Mifflin Harcourt