Questions 2-5. Consider the data in the table. Absolute Relative Percent Time Value |Change Change Increase 13.60 1 14.85 2 16.10 3 17.35 4 18.60 5 19.85 Which model would better represent this data, linear or exponential? Why?
Questions 2-5. Consider the data in the table. Absolute Relative Percent Time Value |Change Change Increase 13.60 1 14.85 2 16.10 3 17.35 4 18.60 5 19.85 Which model would better represent this data, linear or exponential? Why?

Chapter6: Exponential And Logarithmic Functions
Section6.8: Fitting Exponential Models To Data
Problem 3TI: Table 6 shows the population, in thousands, of harbor seals in the Wadden Sea over the years 1997 to...

Related questions
Question
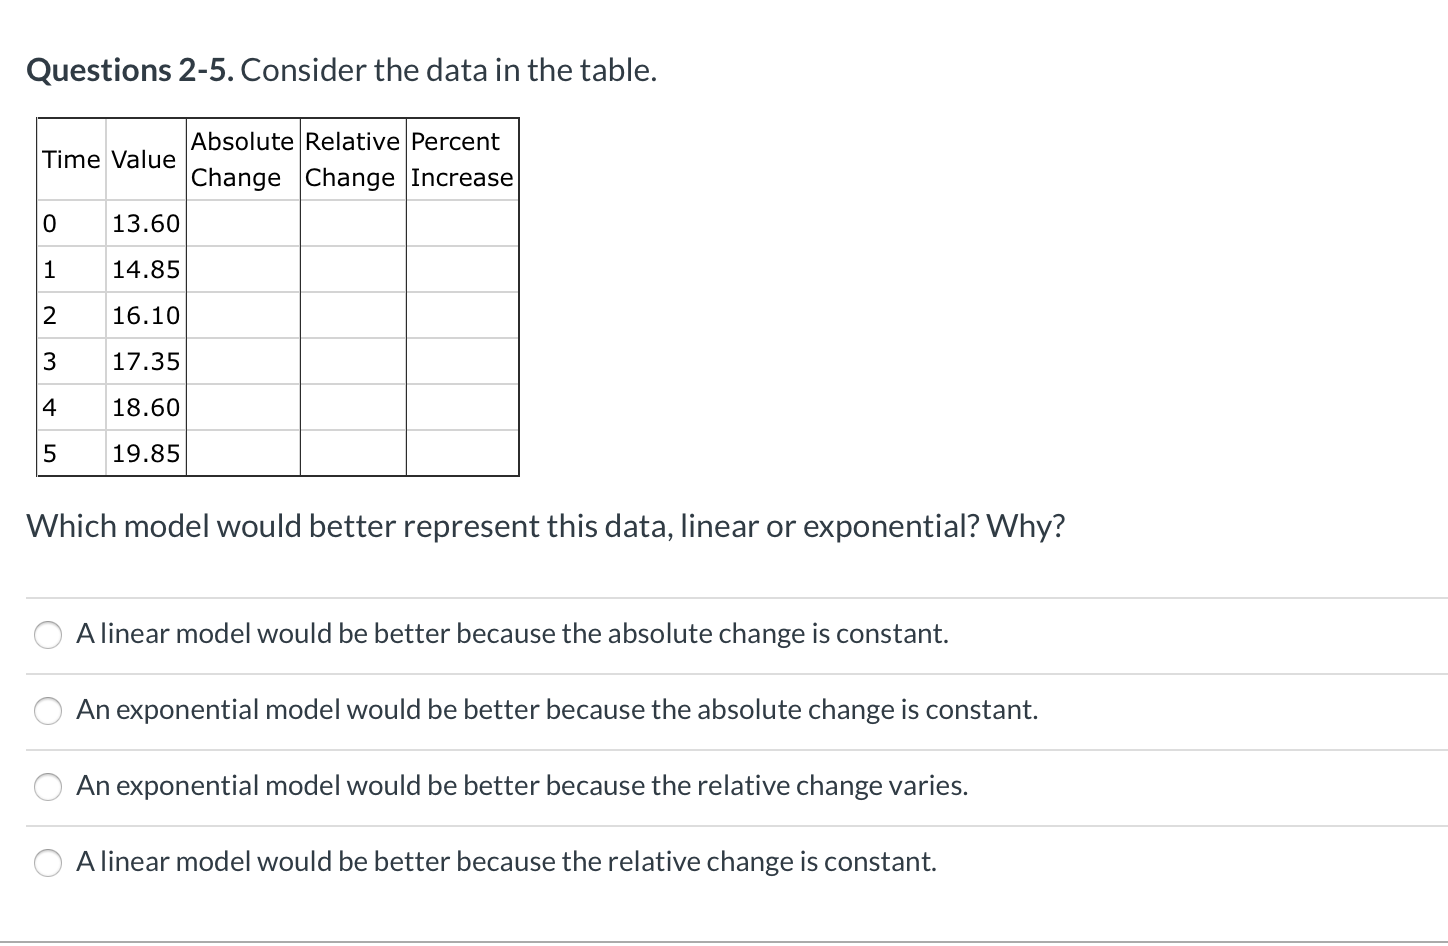
Transcribed Image Text:Questions 2-5. Consider the data in the table.
Absolute Relative Percent
Time Value
|Change Change Increase
13.60
1
14.85
2
16.10
3
17.35
4
18.60
5
19.85
Which model would better represent this data, linear or exponential? Why?
Expert Solution
This question has been solved!
Explore an expertly crafted, step-by-step solution for a thorough understanding of key concepts.

This is a popular solution!

Trending now
This is a popular solution!

Step by step
Solved in 2 steps with 2 images

Knowledge Booster


Learn more about
Need a deep-dive on the concept behind this application? Look no further. Learn more about this topic, advanced-math and related others by exploring similar questions and additional content below.Recommended textbooks for you

College Algebra
Algebra
ISBN:
9781305115545
Author:
James Stewart, Lothar Redlin, Saleem Watson
Publisher:
Cengage Learning

Algebra & Trigonometry with Analytic Geometry
Algebra
ISBN:
9781133382119
Author:
Swokowski
Publisher:
Cengage
College Algebra
Algebra
ISBN:
9781305115545
Author:
James Stewart, Lothar Redlin, Saleem Watson
Publisher:
Cengage Learning
Algebra & Trigonometry with Analytic Geometry
Algebra
ISBN:
9781133382119
Author:
Swokowski
Publisher:
Cengage

Functions and Change: A Modeling Approach to Coll…
Algebra
ISBN:
9781337111348
Author:
Bruce Crauder, Benny Evans, Alan Noell
Publisher:
Cengage Learning


Trigonometry (MindTap Course List)
Trigonometry
ISBN:
9781337278461
Author:
Ron Larson
Publisher:
Cengage Learning