14. Step 1: Global warming may be due to increased concentrations of greenhouse gases such as carbon dioxide (co2). Here are data from the National Oceanic and Atmospheric Administration Web site (www.noaa.gov), where co2 is measured in parts per million by volume: CO, 315.98 324.62 336.78 352.90 368.14 387.35 Year 1959 1969 1979 1989 1999 2009 A regression line for predicting carbon dioxide from time is predicted carbon dioxide concentration = 311.662 1.43866 x (years elapsed since 1959). (Fill in the blanks below and give your answers to 4 decimal places.) What is the slope of this line? (1) For each additional year the amount of carbon dioxide is increasing by (2)_ parts per million by volume. eBook Answer 1 Answer 2 Continue
14. Step 1: Global warming may be due to increased concentrations of greenhouse gases such as carbon dioxide (co2). Here are data from the National Oceanic and Atmospheric Administration Web site (www.noaa.gov), where co2 is measured in parts per million by volume: CO, 315.98 324.62 336.78 352.90 368.14 387.35 Year 1959 1969 1979 1989 1999 2009 A regression line for predicting carbon dioxide from time is predicted carbon dioxide concentration = 311.662 1.43866 x (years elapsed since 1959). (Fill in the blanks below and give your answers to 4 decimal places.) What is the slope of this line? (1) For each additional year the amount of carbon dioxide is increasing by (2)_ parts per million by volume. eBook Answer 1 Answer 2 Continue

Chapter6: Exponential And Logarithmic Functions
Section6.8: Fitting Exponential Models To Data
Problem 3TI: Table 6 shows the population, in thousands, of harbor seals in the Wadden Sea over the years 1997 to...

Related questions
Question
Transcribed Image Text:14.
Step 1:
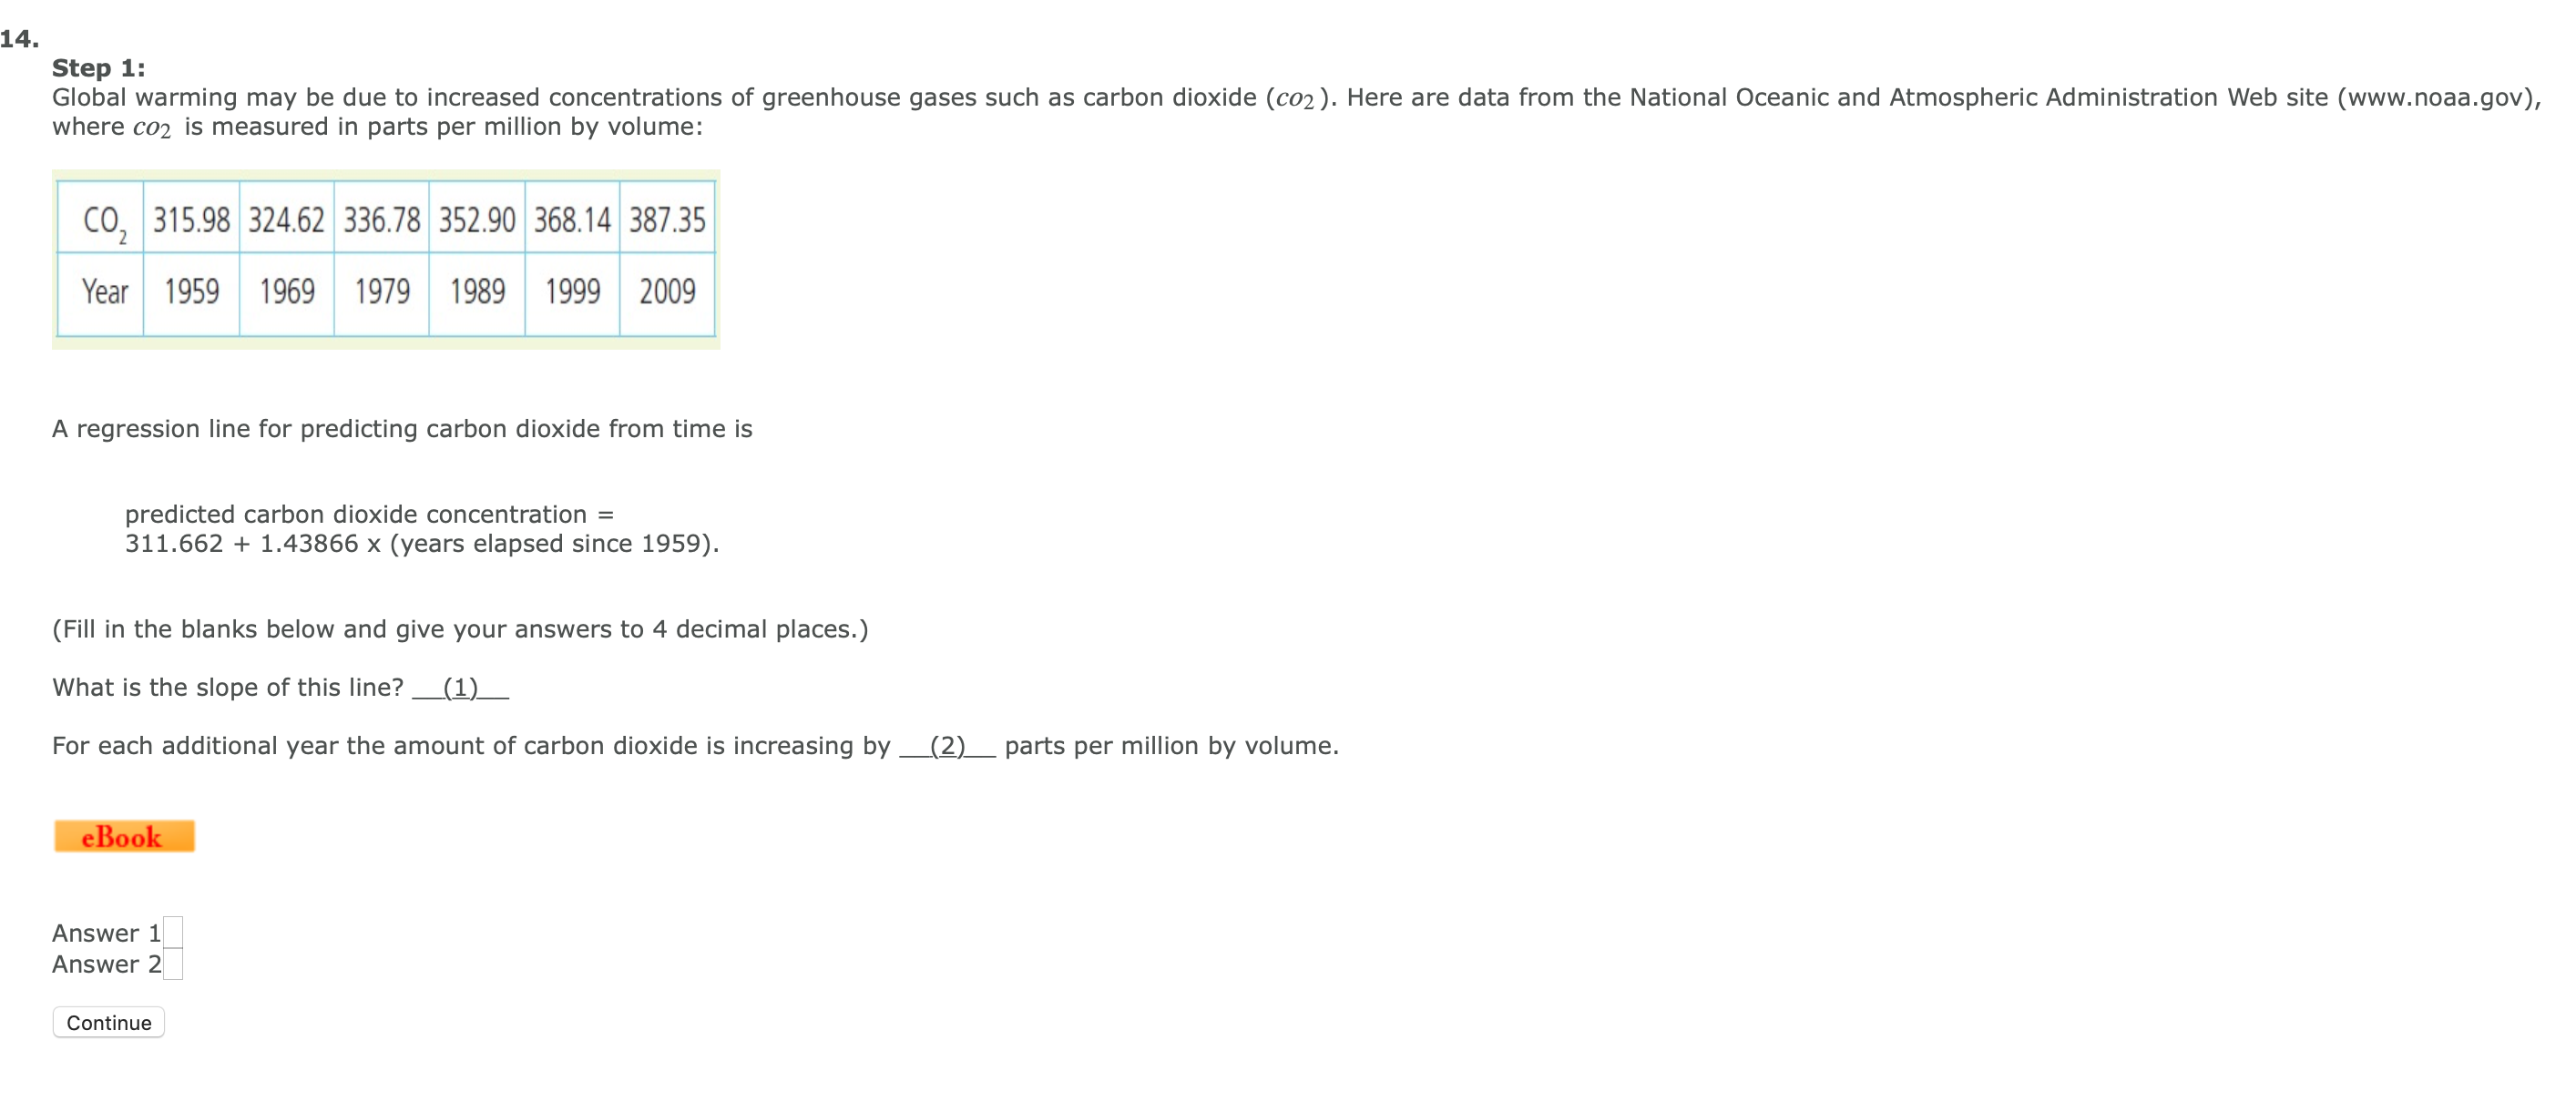
Global warming may be due to increased concentrations of greenhouse gases such as carbon dioxide (co2). Here are data from the National Oceanic and Atmospheric Administration Web site (www.noaa.gov),
where co2 is measured in parts per million by volume:
CO, 315.98 324.62 336.78 352.90 368.14 387.35
Year 1959 1969
1979 1989 1999 2009
A regression line for predicting carbon dioxide from time is
predicted carbon dioxide concentration =
311.662 1.43866 x (years elapsed since 1959).
(Fill in the blanks below and give your answers to 4 decimal places.)
What is the slope of this line?
(1)
For each additional year the amount of carbon dioxide is increasing by
(2)_ parts per million by volume.
eBook
Answer 1
Answer 2
Continue
Expert Solution
This question has been solved!
Explore an expertly crafted, step-by-step solution for a thorough understanding of key concepts.

This is a popular solution!

Trending now
This is a popular solution!

Step by step
Solved in 2 steps

Recommended textbooks for you

College Algebra
Algebra
ISBN:
9781305115545
Author:
James Stewart, Lothar Redlin, Saleem Watson
Publisher:
Cengage Learning

Functions and Change: A Modeling Approach to Coll…
Algebra
ISBN:
9781337111348
Author:
Bruce Crauder, Benny Evans, Alan Noell
Publisher:
Cengage Learning
College Algebra
Algebra
ISBN:
9781305115545
Author:
James Stewart, Lothar Redlin, Saleem Watson
Publisher:
Cengage Learning
Functions and Change: A Modeling Approach to Coll…
Algebra
ISBN:
9781337111348
Author:
Bruce Crauder, Benny Evans, Alan Noell
Publisher:
Cengage Learning

Algebra and Trigonometry (MindTap Course List)
Algebra
ISBN:
9781305071742
Author:
James Stewart, Lothar Redlin, Saleem Watson
Publisher:
Cengage Learning