Do the odds of churning increase or decrease when the customer is a senior citizen compared to a non-senior citizen (reference level)? Show the calculation of the odds.
Do the odds of churning increase or decrease when the customer is a senior citizen compared to a non-senior citizen (reference level)? Show the calculation of the odds.

Functions and Change: A Modeling Approach to College Algebra (MindTap Course List)
6th Edition
ISBN:9781337111348
Author:Bruce Crauder, Benny Evans, Alan Noell
Publisher:Bruce Crauder, Benny Evans, Alan Noell
Chapter5: A Survey Of Other Common Functions
Section5.3: Modeling Data With Power Functions
Problem 6E: Urban Travel Times Population of cities and driving times are related, as shown in the accompanying...

Related questions
Question
Do the odds of churning increase or decrease when the customer is a senior citizen compared to a non-senior citizen (reference level)? Show the calculation of the odds.
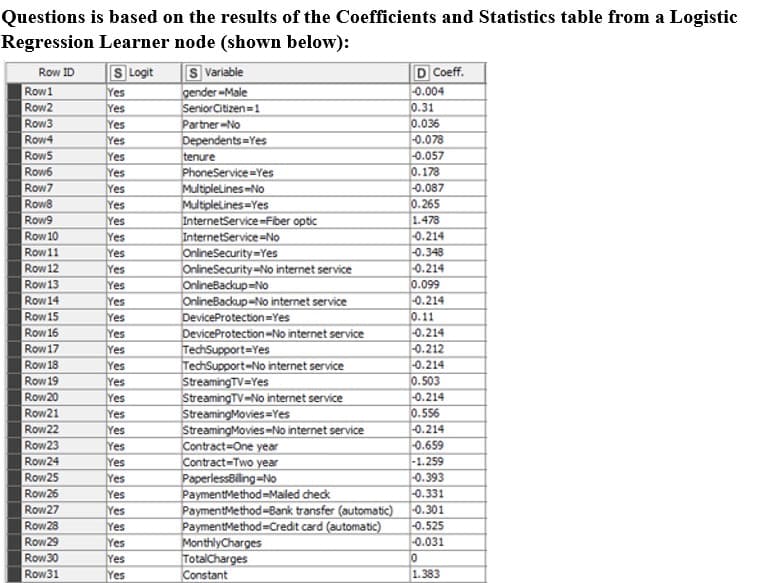
Transcribed Image Text:Questions is based on the results of the Coefficients and Statistics table from a Logistic
Regression Learner node (shown below):
Row ID
Row 1
Row 2
Row 3
Row4
RowS
Row6
Row7
Row8
Row9
Row 10
Row 11
Row 12
Row 13
Row 14
Row 15
Row 16
Row 17
Row 18
Row 19
Row 20
Row 21
Row 22
Row 23
Row 24
Row 25
Row 26
Row 27
Row 28
Row 29
Row 30
Row 31
S Logit
Yes
Yes
Yes
Yes
Yes
Yes
Yes
Yes
Yes
Yes
Yes
Yes
Yes
Yes
Yes
Yes
Yes
Yes
Yes
Yes
Yes
Yes
Yes
Yes
Yes
Yes
Yes
Yes
Yes
Yes
Yes
S Variable
gender-Male
Senior Citizen=1
Partner-No
Dependents Yes
tenure
PhoneService-Yes
MultipleLines-No
Multiplelines-Yes
InternetService-Fiber optic
InternetService-No
OnlineSecurity Yes
OnlineSecurity-No internet service
OnlineBackup-No
OnlineBackup-No internet service
DeviceProtection Yes
DeviceProtection-No internet service
TechSupport Yes
TechSupport-No internet service
StreamingTV=Yes
StreamingTV-No internet service
StreamingMovies Yes
Streaming Movies-No internet service
Contract-One year
Contract-Two year
PaperlessBilling-No
Payment Method-Mailed check
Payment Method-Bank transfer (automatic)
Payment Method Credit card (automatic)
MonthlyCharges
TotalCharges
Constant
DCoeff.
-0.004
0.31
0.036
-0.078
-0.057
0.178
-0.087
0.265
1.478
-0.214
-0.348
-0.214
0.099
-0.214
0.11
-0.214
-0.212
-0.214
0.503
-0.214
0.556
-0.214
-0.659
-1.259
-0.393
-0.331
-0.301
-0.525
-0.031
0
1.383
Expert Solution
This question has been solved!
Explore an expertly crafted, step-by-step solution for a thorough understanding of key concepts.

This is a popular solution!

Trending now
This is a popular solution!

Step by step
Solved in 2 steps

Recommended textbooks for you
Functions and Change: A Modeling Approach to Coll…
Algebra
ISBN:
9781337111348
Author:
Bruce Crauder, Benny Evans, Alan Noell
Publisher:
Cengage Learning

Linear Algebra: A Modern Introduction
Algebra
ISBN:
9781285463247
Author:
David Poole
Publisher:
Cengage Learning
Functions and Change: A Modeling Approach to Coll…
Algebra
ISBN:
9781337111348
Author:
Bruce Crauder, Benny Evans, Alan Noell
Publisher:
Cengage Learning
Linear Algebra: A Modern Introduction
Algebra
ISBN:
9781285463247
Author:
David Poole
Publisher:
Cengage Learning