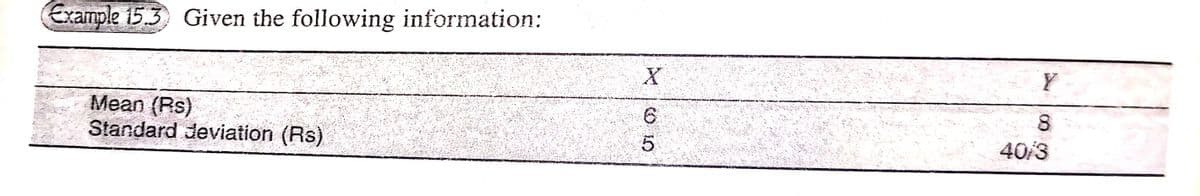
r= 8/15. Find (i) the regression coefficient of X on Y (ii) the regression coefficient of Y on X (iii) the most likely value of Y when X = Rs 100.


Q: Write the following into tree diagram. 1. Tossing a coin 3 times 2. Roll a dice twice III. swer:
A:
Q: 1. A survey of 30 college students found that the average amount they slept per night was 7.2 hours.…
A: It is given that Sample size n = 30 Sample mean M = 7.2 Population SD = 0.9 The critical value of z…
Q: BBy the Uniqueness Property of the MGF, what is the O Find the mean and variance of W using its…
A:
Q: For each item, identify if the type of sample is related or independent. 1. Prof. Antonio believes…
A: Hello! As you have posted 2 different questions, we are answering the first question. In case you…
Q: Q 1/ Given a random variable having the normal distribution with µ=16 and o?=1.5625. the…
A: A random variable is normally distributed with mean 16 and variance 1.5625 μ=16σ2=1.5625
Q: Suppose that the starting salaries of MBAS at Wilfrid Laurier University (WLU) are normally…
A:
Q: n the election a state representative received 52% of the votes cast. One year after the election,…
A: Given that n=300 , p=52%=0.52 , q=1-p=1-0.52=0.48 Find P(X>half of the…
Q: Q1: Let x1, X2,.. ,Xn,Xn+1 be a random sample of size n + 1,n > 1, from a distribution tha N(H, o?).…
A: Given Xi~ N(μ, σ2) ; i=1,2,...,n,(n+1)
Q: For a T distribution, (a) Find P(T 1.318) when v = 24. (c) Find P(-1.356 -2567) when v= 17
A: Hello! As you have posted more than 3 sub parts, we are answering the first 3 sub-parts. In case…
Q: 2) The proportion of time, X, that a manufacturing machine is in operation during an 8-hour shift is…
A: In question, We have given X is random variable having pdf f(x). Then we'll find E(X) and V(X). The…
Q: The lifetime of a certain brand of battery is known to have a standard deviation of 16 hours.…
A: Given that Sample Mean \bar XXˉ = 33.133.1 Population Standard Deviation (\sigma)(σ) = 1616…
Q: An insurance company checks police records on 598 accidents selected at random and notes that…
A:
Q: If, however, you were unable to collect data of your own, then state this and explain why. Instead…
A: Given the data of the measurements that correspond to seedlings whose stems were cut during their…
Q: Obesity seems to increase risk for COVID-19 patients. Researchers want to compare survival (yes vs.…
A: We have given the following statement about the obesity.
Q: A discrete distribution for X is given by the following tabte! -6 -5 -2 1 0,01 -1 5 7. 10 11 13 14…
A: The objective is to determine the mean, variance of the given discrete probability distribution.
Q: For each item, identify if the type of sample is related or independent. 1. Prof. Antonio believes…
A: Hello! As you have posted 2 different questions, we are answering the first question. In case you…
Q: Among college students, the proportion p who say they're interested in their congressional…
A: Given that Sample size n =260 Favorable cases x =185 Sample proportion p^=x/n =185/260 =0.7115…
Q: The national distribution of fatal work injuries in a country is shown in the table to the right…
A:
Q: The average cost per household of owning a brand new car is ₱5500. Suppose that we randomly selected…
A: Let X be the random variable from normal distribution with mean (μ) = 5500, standard deviation (σ) =…
Q: Choose the correct answer below. 3. 100% accuracy is POSSIBLE in accepting or rejecting a…
A: Given problems related to hypothesis testing, we have to choose the correct options.
Q: Ex-1 Write down the outcome set or the sample space in the following experiments: (a) A coin is…
A: Given that Write down the outcome set or the sample space in the following experiments: (a) A coin…
Q: If a card is drawn randomly from a deck of 52 cards find the probability of getting. Find 1. A…
A:
Q: Is there enough evidence to support the college's claim at 5% level of significance?
A: It is given that Sample size n = 100 Number of unemployed, X = 27 Level of significance = 0.05
Q: Suppose you have two years' worth of panel data on wages and work experience of adults; however, the…
A: Please find the explanation below. Thank you
Q: Among US cities with a population of more than 250,000, the median commute time to work is 24.3…
A: The mean is 38.3 and the standard deviation is 7.5.
Q: Exercise 1 Fortitude Insurance sells extended car warranties over the phone. They call people using…
A:
Q: cording to a report done by S& J Power, the mean lifetime of the light bulbs it manufactures is 45…
A: We have given that. Population mean (µ) = 45 Sample size (n) = 90 Sample mean (x̅) = 44Standard…
Q: A-4. Suppose the independent variable is X and the dependent variable is Y, what is the most…
A: What is the most appropriate regression equation for testing how a percentage increase in x…
Q: Given a normally distributed population with a mean of 100 and variance 100, find ) P(90 s xs 115)…
A:
Q: What is the correct alternative hypothesis for the following conjecture – the average price of a 1/2…
A: Given that Population mean μ =39800 Alternative hypothesis is H1.
Q: 2. A survey of 20 people asked, "If you've ever been married, how old were you when you were first…
A: We have given that Sample mean = 22.3 Sample standard deviation = 4.8 Sample size = 20
Q: normal distribution, what is the probability that there will be 11 or more outages in any one month?
A: Here given sample size=n=22 p=0.7 Here given distribution approximately closely with normal…
Q: Given a normally distributed population with a mean of 100 and variance 100, find ) P(90 s xs 115)…
A: As per company guidelines I solved exactly three subparts of this question.thank you
Q: ccording to a report done by S&J Power, the mean lifetime of the light bulbs it manufactures is 45…
A: For the given data Find the hypotheses
Q: 2. Random samples of size n=2 are drawn from population consisting of the numbers 5, 6, 7, 8, and 9.…
A: Given that d. List all the possible samples with their corresponding means. e. Construct a…
Q: A psychologist is studying the self image of smokers, which she measures by the self-image (SI)…
A: Given that Margin of error =E =15 Population standard deviation =80
Q: / Given a random variable having the normal distribution with u-16 and o-1.5625. Find probabilities…
A: Let X be the random variable from normal distribution with mean (μ) = 17, variance (σ2) = 1.5625…
Q: A company providing mobile phone service plans has a list of phone numbers for their 125,000…
A:
Q: The table below represents a frequency distribution of marks for 110 students in mathematics in a…
A:
Q: Let X1, X f(r;0) where r.S. 72 { Ox-1 if 00 S(r;0) = 0. %3D elsewhere Find a UMP test for testing…
A:
Q: Use Chebyshev’s inequality to show that a random graph G∈G_(n,p) almost surely does not contain a…
A: Given information: It is required to show that a random graph G ∈ G_(n, p) does not contain a copy…
Q: A manufacturer claims that the batteries for a laptop can last up to 6 hours from full charge. State…
A: A manufacturer claims that the batteries for a laptop can last up to 6 hours from full charge.
Q: A company providing mobile phone service plans has a list of phone numbers for their 125,000…
A:
Q: unbinsed statistie for e ? skow thet is an and kes variance
A:
Q: B-1. As a side business, Mr Happy, keeps a fleet of luxury limousines that he rents out to a few…
A: "Since you have posted a question with multiple sub-parts, we will solve the first three sub-parts…
Q: If you are given n=593 and p=0.3 for a binomial experiment, use the normal distribution to…
A: Given n=593, p=0.3
Q: a) Find the values of A, B, C and D? p) Is there a difference between treatments? Use a = 0.01.
A: Test is that whether there is a difference between treatments. It is given that Level of…
Q: 3. 8. 10 A researcher wishes to estimate the proportion of X-ray machines that malfunction. A random…
A:
Q: Gasoline pumped from a supplier’s pipeline is supposed to have an octane rating of 87.5. On 13…
A: Given that 88.6 86.4 87.2 88.4 87.2 87.6 86.8 86.1 87.4 87.3 86.4 86.6 87.1 Mean =87.16 Standard…
Q: According to a report done by S&J Power, the mean lifetime of the light bulbs it manufactures is 45…
A: Given that, the mean lifetime of the light bulbs is 45 months. A researcher for a consumer advocate…


Step by step
Solved in 2 steps with 2 images

- Olympic Pole Vault The graph in Figure 7 indicates that in recent years the winning Olympic men’s pole vault height has fallen below the value predicted by the regression line in Example 2. This might have occurred because when the pole vault was a new event there was much room for improvement in vaulters’ performances, whereas now even the best training can produce only incremental advances. Let’s see whether concentrating on more recent results gives a better predictor of future records. (a) Use the data in Table 2 (page 176) to complete the table of winning pole vault heights shown in the margin. (Note that we are using x=0 to correspond to the year 1972, where this restricted data set begins.) (b) Find the regression line for the data in part ‚(a). (c) Plot the data and the regression line on the same axes. Does the regression line seem to provide a good model for the data? (d) What does the regression line predict as the winning pole vault height for the 2012 Olympics? Compare this predicted value to the actual 2012 winning height of 5.97 m, as described on page 177. Has this new regression line provided a better prediction than the line in Example 2?Consider a simple linear regression model Y=α+βX+ε. We have collected 15 samples, from which we calculated the summary statistics ∑xi=66, ∑x2i=6568, ∑yi=459, ∑y2i=27933, ∑xiyi=11311. Suppose one of the data is supposed to be (x1=10, y1=30), but is incorrectly recorded as (x1=7, y1=34). All other observations are correctly recorded. What is the OLS estimators αˆ= ? and βˆ= ? based on the correct data.A. Identify the regression analyses necessary for testing this initial model. B. What are the direct and indirect effects of z2 on z5?
- Suppose we want to predict job performance of mechanics based on mechanical aptitude test scores and test scores from personality test that measures conscientiousness. (a) Determine the regression equation. (b) Determine the SSE. Y X1 X2 1 40 25 2 45 20 1 38 30 3 50 30 2 48 28 3 55 30 3 53 34 4 55 36 4 58 32 3 40 34 5 55 38 3 48 28 3 45 30 2 55 36 4 60 34 5 60 38 5 60 42 5 65 38 4 50 34 3 58 38 Where Y is the Performance of the mechanics, X1 is the mechanical aptitude test and X2 is the personality test score that measure conscientiousness.I have some doubts regarding linear regression. if any 2 variables in X1, X2 AND Y have a positive correlation, then in the linear regression Y = b0 + b1X1 +b2X2 +e, will the sign of b1 and b2 both be positive? will the residuals that we get from linear regression will always be uncorrelated given X?justify the reasons for the in1.Econometrics deals with the measurement of economic relationships which are stochastic or random. The simplest form of economic relationships between two variables X and Y can be represented by: ; where are regression parameters and the stochastic disturbance term Justify the reasons for the insertion of U-term in the modelsertion of of u (error term) in the model Y=a+bX+u?
- There is a linear regression: Yi = B0+ B1(Xi^2)+ ei present, where Xi is squared. ei ∼ N(0,σ2). How would I derive LSE for B0 and B1 and their variance?Just parts d,e anf f of question 1 d) We conduct a simple regression of size on hhinc, now using robust standard errors. The regression output is reported in Table 2. Why are the estimated coefficients in Table 2 equal to the estimated coefficients in Table 1? Do the conclusions on the statistical significance at 5% of the coefficient of hhinc change between Tables 1 and 2? e) Now, using both the critical value and the p-value, test whether the coefficient of hhinc is statistically significant at 1%, by using the results in Table 1. Repeat the test by using the results in Table 2. Compare the results based on Table 1 with the results based on Table 2. Consider the results in Table 2. Compute the 99% confidence interval for hhinc. f) Consider the results in Table 2.How would you decide whether 0 is contained in the 99% confidence interval for the coefficient of hhinc, without actually computing the confidence interval?If there is a positive correlation between X and Y then in the regression equation, Y = bX + a, ____.
- Suppose that the sales of a company (Y) is regressed on advertising expenditure (x) and labor cost (z), and the estimated regression equation is Y = 5 + 0.5x + 0.7z + u (where u is the error term). Here, sales, advertising expenditure and labor cost are measured in million Tk. Standard error for the coefficient of x is 0.04, standard error for the coefficient of z is 0.01, and the sample size is 20. Can we conclude that advertising expenditure is a statistically significant variable?For the regression model Yi = b0 + eI, derive the least squares estimator.The first step of the Durbin-Watson test for the presence of autocorrelation is to estimate the model and determine Select one: a. the residuals lagged one period. b. the current period residuals and the residuals lagged one period. c. the current period residuals. d. the current period residuals, the residuals lagged one period, and the residuals lagged two periods.

