R1.33. Age and party 2011 The Pew Research Center conducts surveys regularly asking respondents which political party they identify with or lean toward. Among their results is the following table relating preferred political party and age. Age 18-29 30-49 50-64 65+ Total Republican/ Lean Rep. 318 991 1260 1136 3705 Party Democrat/ Lean Dem. 424 1058 1407 1087 3976 Neither 73 203 264 193 733 Total 815 2252 2931 2416 8414 a) What percent of people surveyed were Republicans or leaned Republican? b) Do you think this might be a reasonable estimate of the percentage of all voters who are Republicans or lean Republicans? Explain. c) What percent of people surveyed were under 30 or over 65? d) What percent of people were classified as "Neither" and under the age of 30? e) What percent of the people classified as "Neither" were under 30? f) What percent of people under 30 were classified as "Neither"?
R1.33. Age and party 2011 The Pew Research Center conducts surveys regularly asking respondents which political party they identify with or lean toward. Among their results is the following table relating preferred political party and age. Age 18-29 30-49 50-64 65+ Total Republican/ Lean Rep. 318 991 1260 1136 3705 Party Democrat/ Lean Dem. 424 1058 1407 1087 3976 Neither 73 203 264 193 733 Total 815 2252 2931 2416 8414 a) What percent of people surveyed were Republicans or leaned Republican? b) Do you think this might be a reasonable estimate of the percentage of all voters who are Republicans or lean Republicans? Explain. c) What percent of people surveyed were under 30 or over 65? d) What percent of people were classified as "Neither" and under the age of 30? e) What percent of the people classified as "Neither" were under 30? f) What percent of people under 30 were classified as "Neither"?

Glencoe Algebra 1, Student Edition, 9780079039897, 0079039898, 2018
18th Edition
ISBN:9780079039897
Author:Carter
Publisher:Carter
Chapter10: Statistics
Section: Chapter Questions
Problem 13PT

Related questions
Question
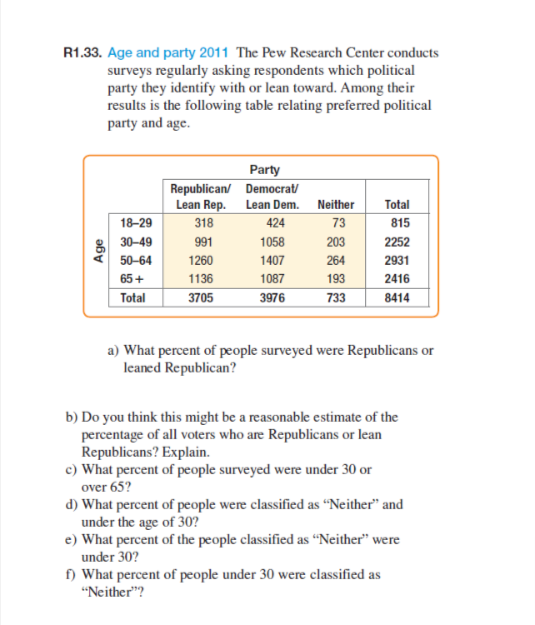
Transcribed Image Text:R1.33. Age and party 2011 The Pew Research Center conducts
surveys regularly asking respondents which political
party they identify with or lean toward. Among their
results is the following table relating preferred political
party and age.
Age
18-29
30-49
50-64
65+
Total
Republican
Lean Rep.
318
991
1260
1136
3705
Party
Democrat/
Lean Dem.
424
1058
1407
1087
3976
Neither
73
203
264
193
733
Total
815
2252
2931
2416
8414
a) What percent of people surveyed were Republicans or
leaned Republican?
c) What percent of people surveyed were under 30 or
over 65?
b) Do you think this might be a reasonable estimate of the
percentage of all voters who are Republicans or lean
Republicans? Explain.
d) What percent of people were classified as "Neither" and
under the age of 30?
e) What percent of the people classified as "Neither" were
under 30?
f) What percent of people under 30 were classified as
"Neither"?
Expert Solution
This question has been solved!
Explore an expertly crafted, step-by-step solution for a thorough understanding of key concepts.

Step by step
Solved in 2 steps with 1 images

Recommended textbooks for you
Glencoe Algebra 1, Student Edition, 9780079039897…
Algebra
ISBN:
9780079039897
Author:
Carter
Publisher:
McGraw Hill

Functions and Change: A Modeling Approach to Coll…
Algebra
ISBN:
9781337111348
Author:
Bruce Crauder, Benny Evans, Alan Noell
Publisher:
Cengage Learning
Glencoe Algebra 1, Student Edition, 9780079039897…
Algebra
ISBN:
9780079039897
Author:
Carter
Publisher:
McGraw Hill
Functions and Change: A Modeling Approach to Coll…
Algebra
ISBN:
9781337111348
Author:
Bruce Crauder, Benny Evans, Alan Noell
Publisher:
Cengage Learning