R^2 for characteristics of a trend model and how well it suits a set of data; cause-and-effect relations from scatter plots. Include the equation for the line/curve of best fit. You can analyze different models: linear, quadratic, exponential, polynomial, etc.
R^2 for characteristics of a trend model and how well it suits a set of data; cause-and-effect relations from scatter plots. Include the equation for the line/curve of best fit. You can analyze different models: linear, quadratic, exponential, polynomial, etc.

Algebra & Trigonometry with Analytic Geometry
13th Edition
ISBN:9781133382119
Author:Swokowski
Publisher:Swokowski
Chapter10: Sequences, Series, And Probability
Section10.8: Probability
Problem 31E

Related questions
Question
100%
Statistical Analysis - Data Management
For the following graph, answer the following:
- mean, median,
mode for thecentral tendency ; st. deviation, variance,range , IQR, Quartiles for a spread of data; Equation of LOBF/ COBF, r, R^2 for characteristics of a trend model and how well it suits a set of data; cause-and-effect relations fromscatter plots. - Include the equation for the line/curve of best fit. You can analyze different models: linear, quadratic, exponential, polynomial, etc.
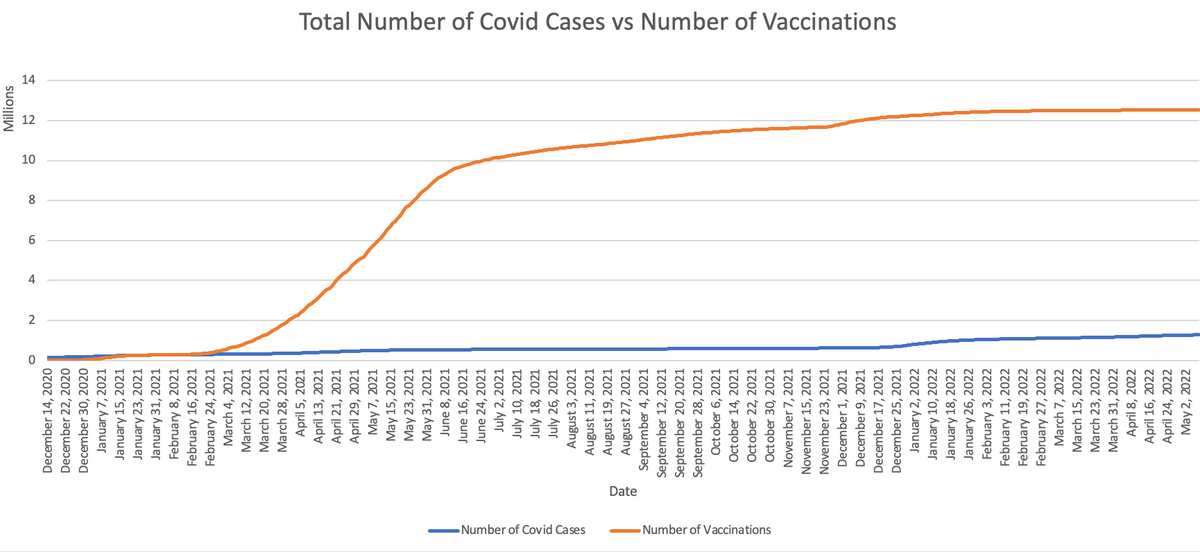
Transcribed Image Text:-Number of Covid Cases
Date
-Number of Vaccinations
December 14, 2020
December 22, 2020
December 30, 2020
January 7, 2021
January 15, 2021
January 23, 2021
January 31, 2021
February 8, 2021
February 16, 2021
February 24, 2021
March 4, 2021
March 12, 2021
March 20, 2021
March 28, 2021
April 5, 2021
April 13, 2021
April 21, 2021
April 29, 2021
May 7, 2021
May 15, 2021
May 23, 2021
May 31, 2021
June 8, 2021
June 16, 2021
June 24, 2021
July 2, 2021
July 10, 2021
July 18, 2021
July 26, 2021
August 3, 2021
August 11, 2021
August 19, 2021
August 27, 2021
September 4, 2021
September 12, 2021
September 20, 2021
September 28, 2021
October 6, 2021
October 14, 2021
October 22, 2021
October 30, 2021
November 7, 2021
November 15, 2021
November 23, 2021
December 1, 2021
December 9, 2021
December 17, 2021
December 25, 2021
January 2, 2022
January 10, 2022
January 18, 2022
January 26, 2022
February 3, 2022
February 11, 2022
February 19, 2022
February 27, 2022
March 7, 2022
March 15, 2022
March 23, 2022
March 31, 2022
April 8, 2022
April 16, 2022
April 24, 2022
May 2, 2022
O
9
Millions
2
8
10
12
Total Number of Covid Cases vs Number of Vaccinations
Expert Solution
This question has been solved!
Explore an expertly crafted, step-by-step solution for a thorough understanding of key concepts.

This is a popular solution!

Trending now
This is a popular solution!

Step by step
Solved in 5 steps with 3 images

Recommended textbooks for you
Algebra & Trigonometry with Analytic Geometry
Algebra
ISBN:
9781133382119
Author:
Swokowski
Publisher:
Cengage

Algebra & Trigonometry with Analytic Geometry
Algebra
ISBN:
9781133382119
Author:
Swokowski
Publisher:
Cengage